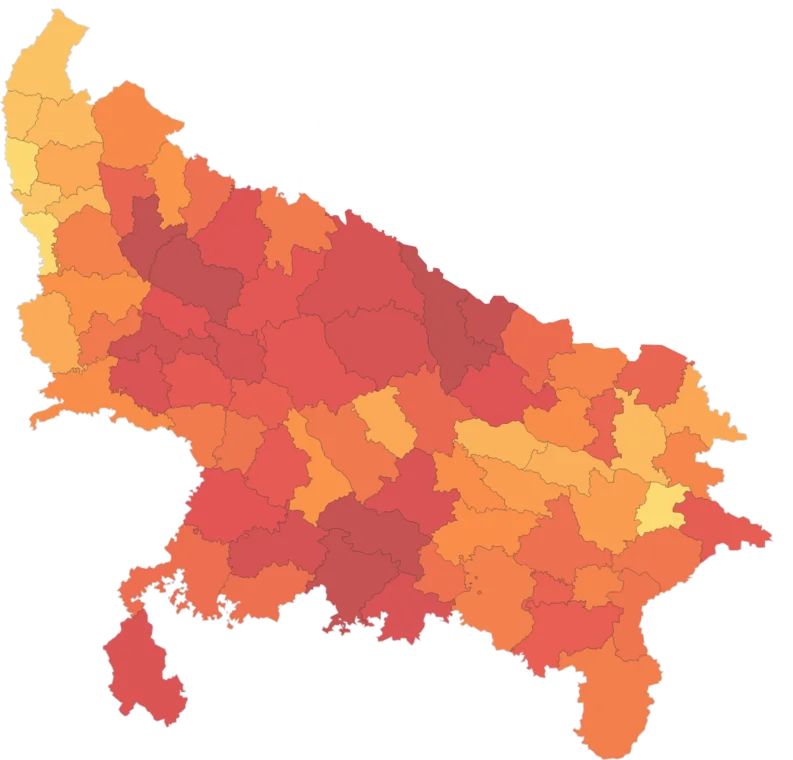
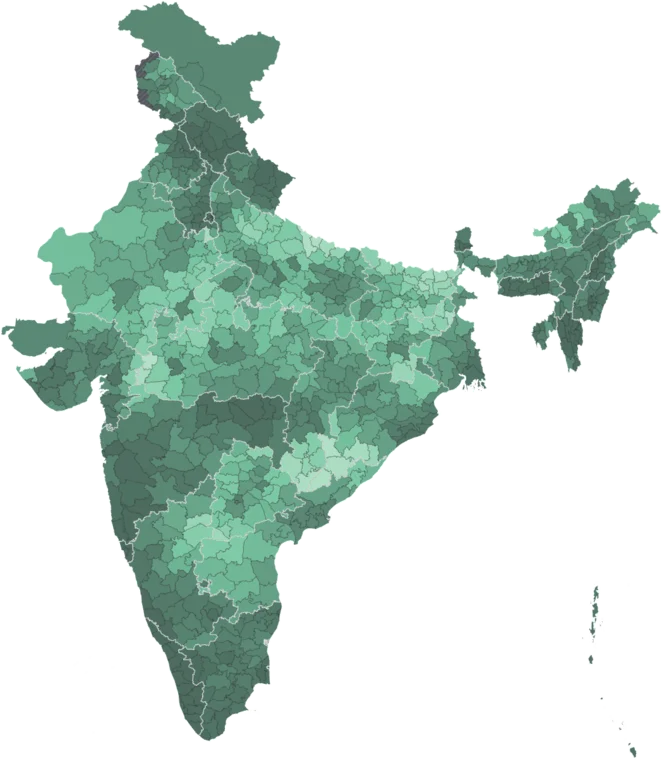
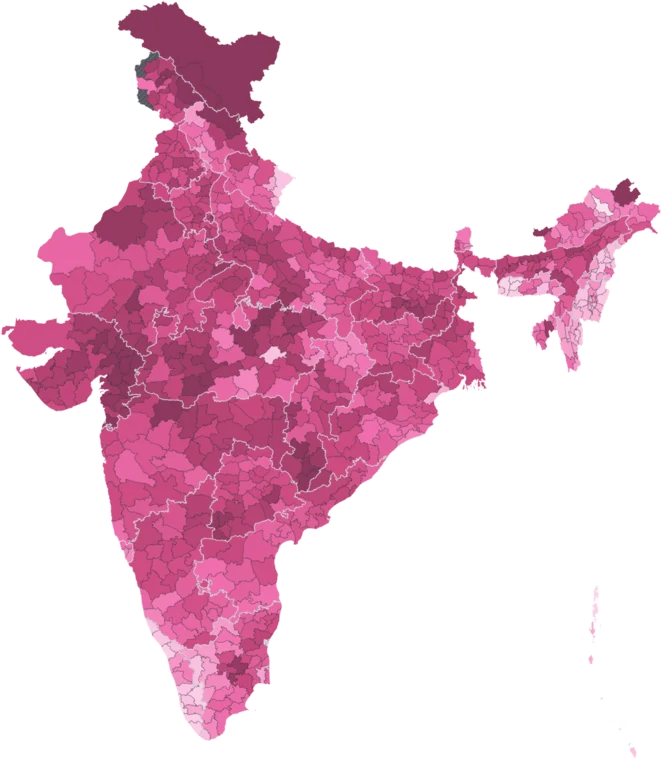
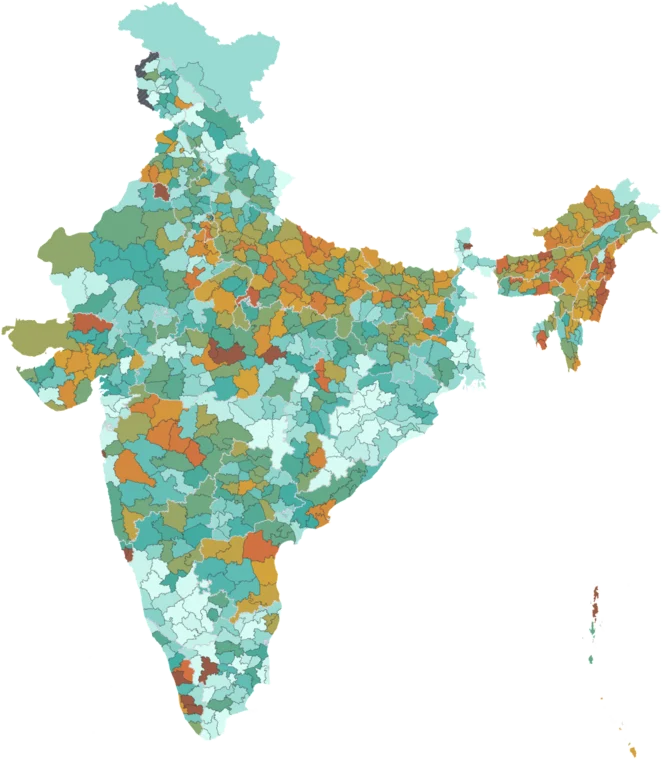
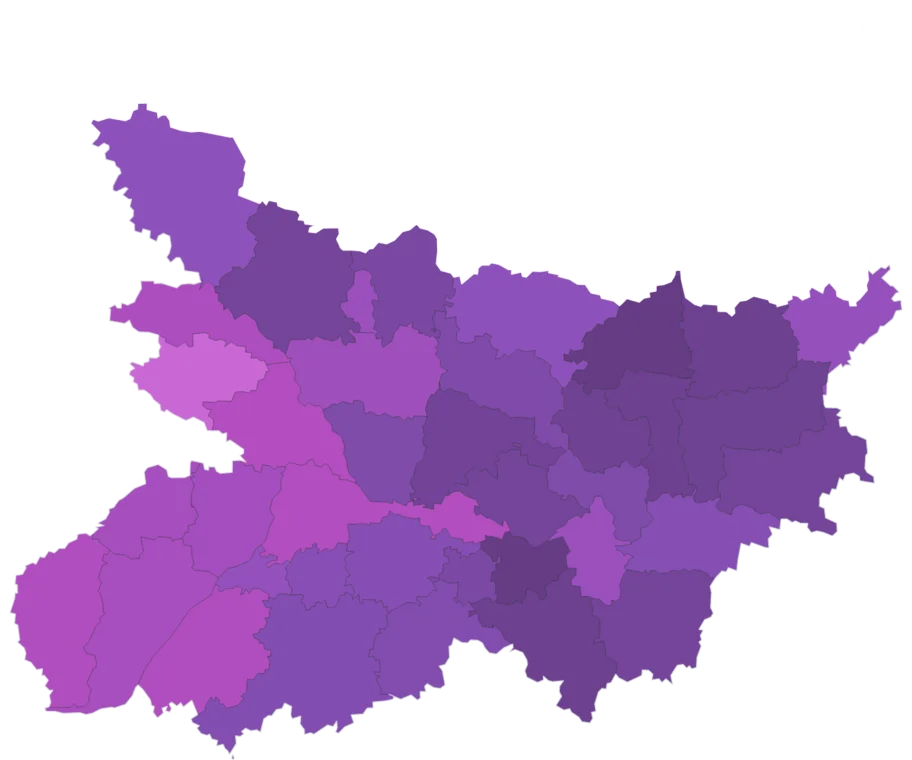
Monsoon Rainfall by district
Rain that fell from June to September 2026, in millimetres, beside the district's normal — its long-term average for the same days.
- National
- 682.1 mm
- area-weighted across districts
- Highest district
- 3,182.5 mm
- Dadra And Nagar Haveli, Dadra & Nagar Haveli & Daman & Diu
- Lowest district
- 21.6 mm
- Kargil, Ladakh
- Districts measured
- 684
- 65 more estimated
The middle 80% of measured districts lie between 230.2 and 1,427.3 mm. 334 of 684 measured districts sit above the national figure of 682.1 mm. 3 of the 10 highest districts are in Maharashtra. Among 36 states and union territories, Dadra & Nagar Haveli & Daman & Diu is highest at 2,995.4 mm and Ladakh lowest at 55 mm.
How districts spread
Each bar is a band of values; its height is the number of districts in it, 684 in all. Colours match the map.
By state
36 states and union territories, area-weighted across districts. The line marks the national figure, 682.1 mm.
Read with care
Caveat
IMD real-time data, not final. Normal is the 1971–2020 average (1961–2010 for 2021). Source gaps and broken rows are left blank; new districts show their parent district's value.
65 districts estimated
Districts formed after the source was published have no reading of their own. Their values are inherited from parent district and are left out of the rankings and the distribution. See the methodology.
Citing this data
Cite the original publisher for published figures and cite us as well where your result depends on the district crosswalk. More limits on the caveats page.