SPATIAL INDIA FOR UPSC PREPARATION
See the India you`re studying for — on one interactive map
Visualize Census 2011, NFHS-5, night-time lights, climate vulnerability, and 85+ indicators across 800+ districts. Turn static tables into spatial understanding. Built for GS-1 Geography, GS-2 Social Justice, and Geography Optional.
WHY STATIC TABLES DON'T BUILD SPATIAL UNDERSTANDING
Census data lives in coaching tables, not maps
You`ve memorised that Kerala has the highest literacy rate and Bihar the lowest. But what does the gradient look like across 800+ districts? Which districts break the state pattern? Static tables give you facts. Maps give you understanding.
NCERT maps cover five indicators. The syllabus covers fifty.
GS-1 and Geography Optional reference population density, sex ratio, urbanisation, tribal distribution, agricultural patterns, climate vulnerability, night-time economic activity, and more. No single study resource maps all of these.
Answer writing needs patterns, not just numbers
A strong UPSC answer connects indicators: "Districts with low female literacy also show high child marriage rates." But seeing that pattern requires comparing two variables spatially — and no coaching material shows you cross-indicator correlations.
YOUR SYLLABUS, VISUALISED
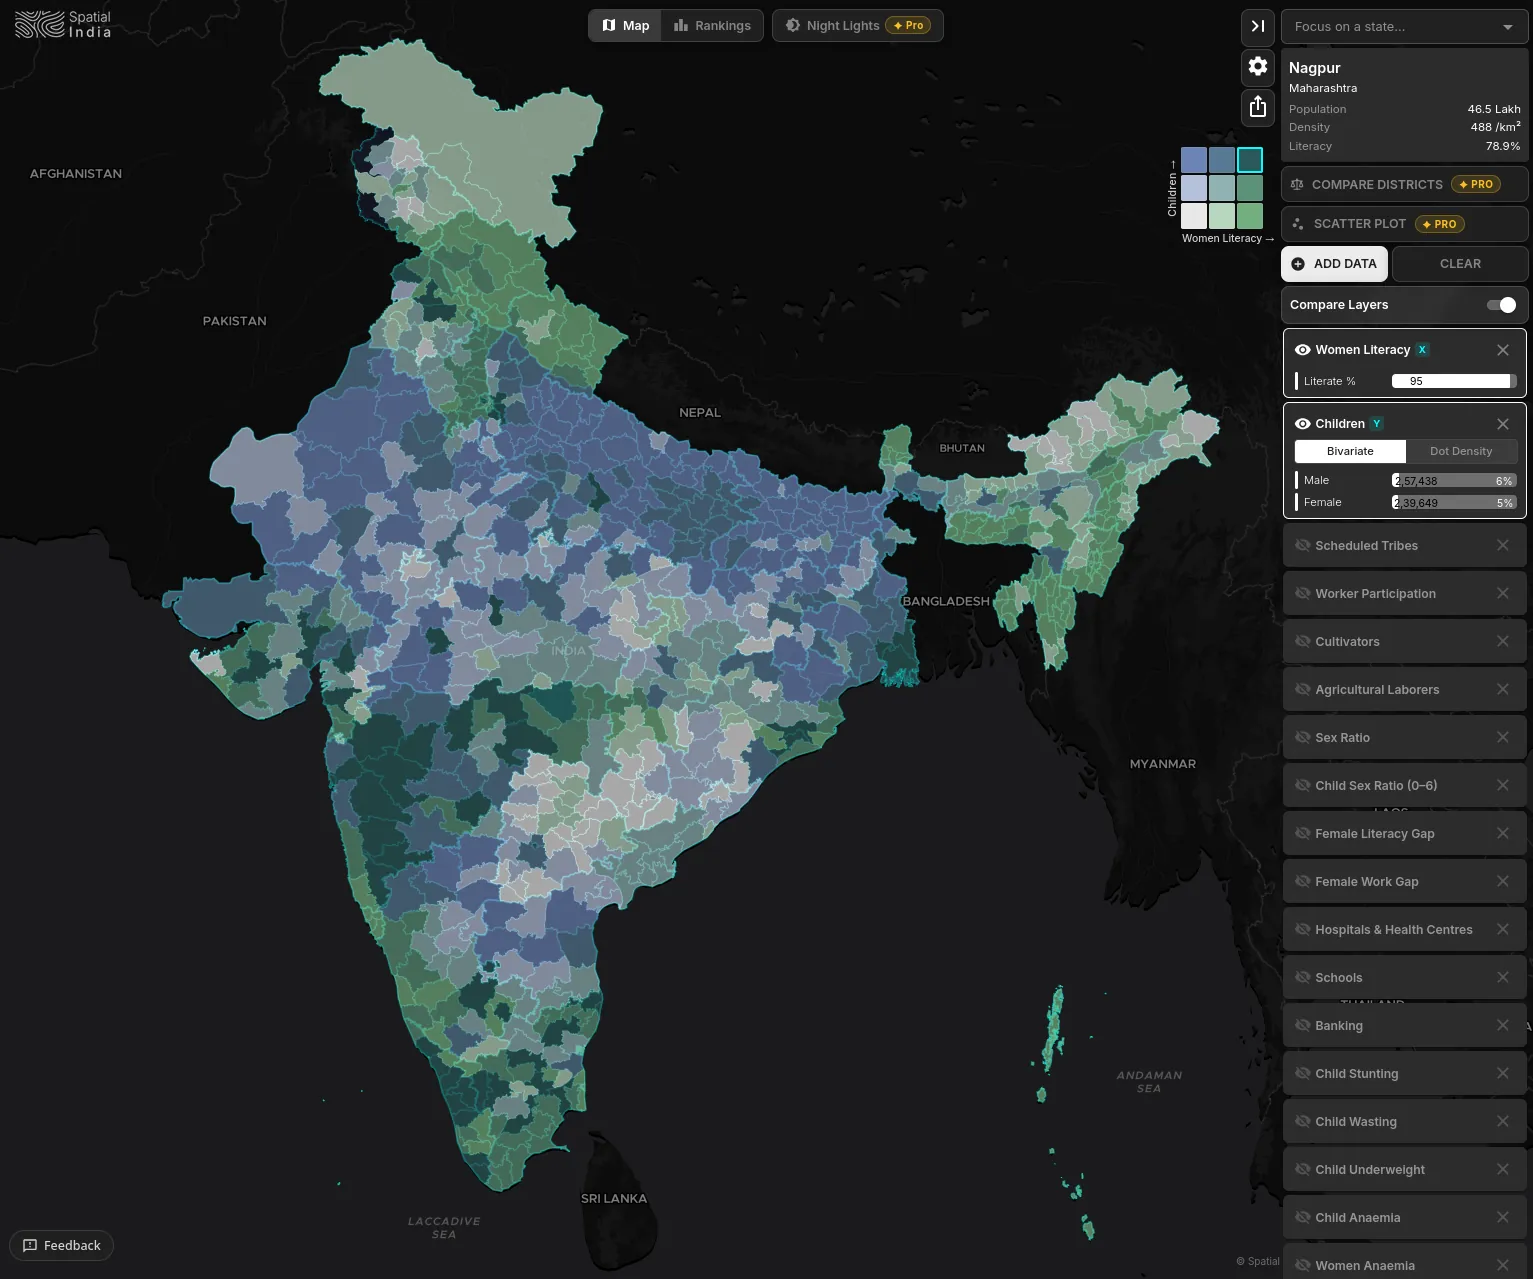
Choropleth Mapping (GS-1: Indian Geography)
Visualize population density, literacy, urbanisation, SC/ST distribution, sex ratio, or any of 85+ indicators across every district. See the spatial patterns that make your answer writing sharper — the North-South literacy gradient, the Eastern India health burden, the Western India urbanisation corridor.
State Focus (GS-2: Federalism & Governance)
Click any state to see only its districts. Compare intra-state disparities — how Bihar's northern districts differ from its southern ones, why Kerala's health metrics vary despite high overall averages. State-level drill-downs that deepen your understanding of Indian federalism.
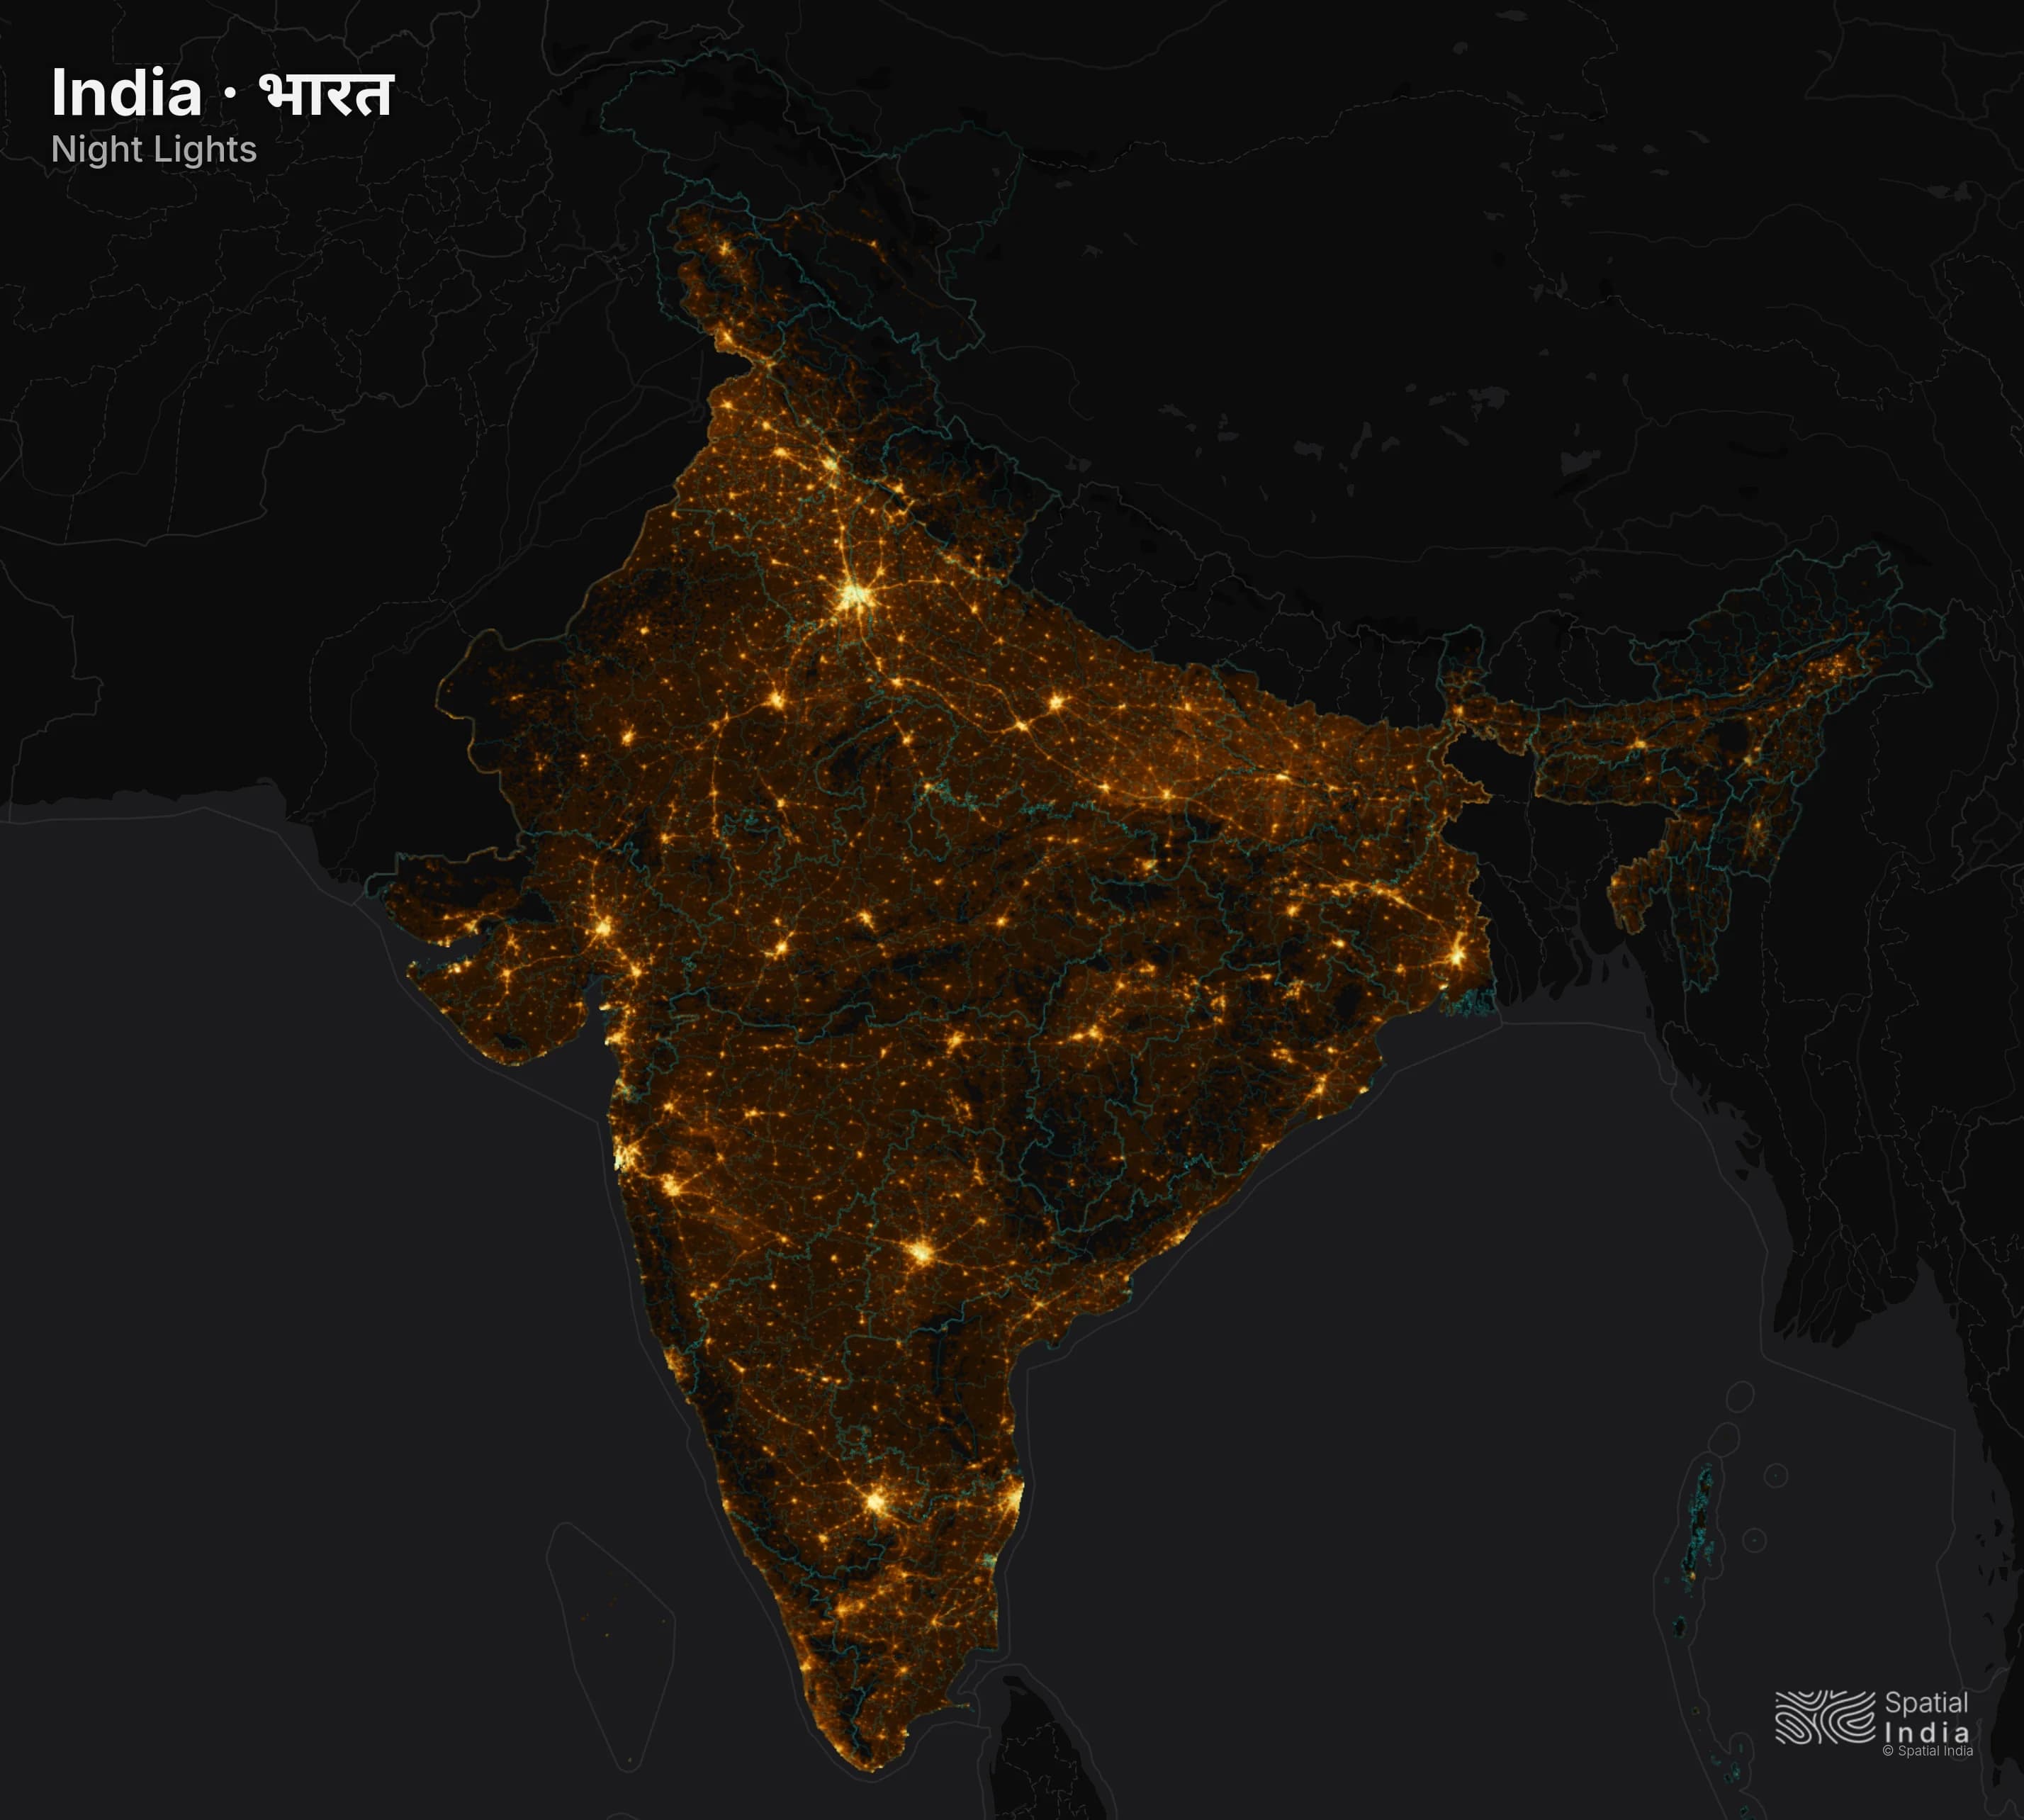
Night-time Lights (GS-3: Economic Development)
Overlay NASA satellite imagery showing where economic activity is concentrated — and where it isn't. Ten years of data (2015–2024). See the Delhi-Mumbai corridor, the dark zones of central India, the brightening of Tier-2 cities. Economic geography from space.
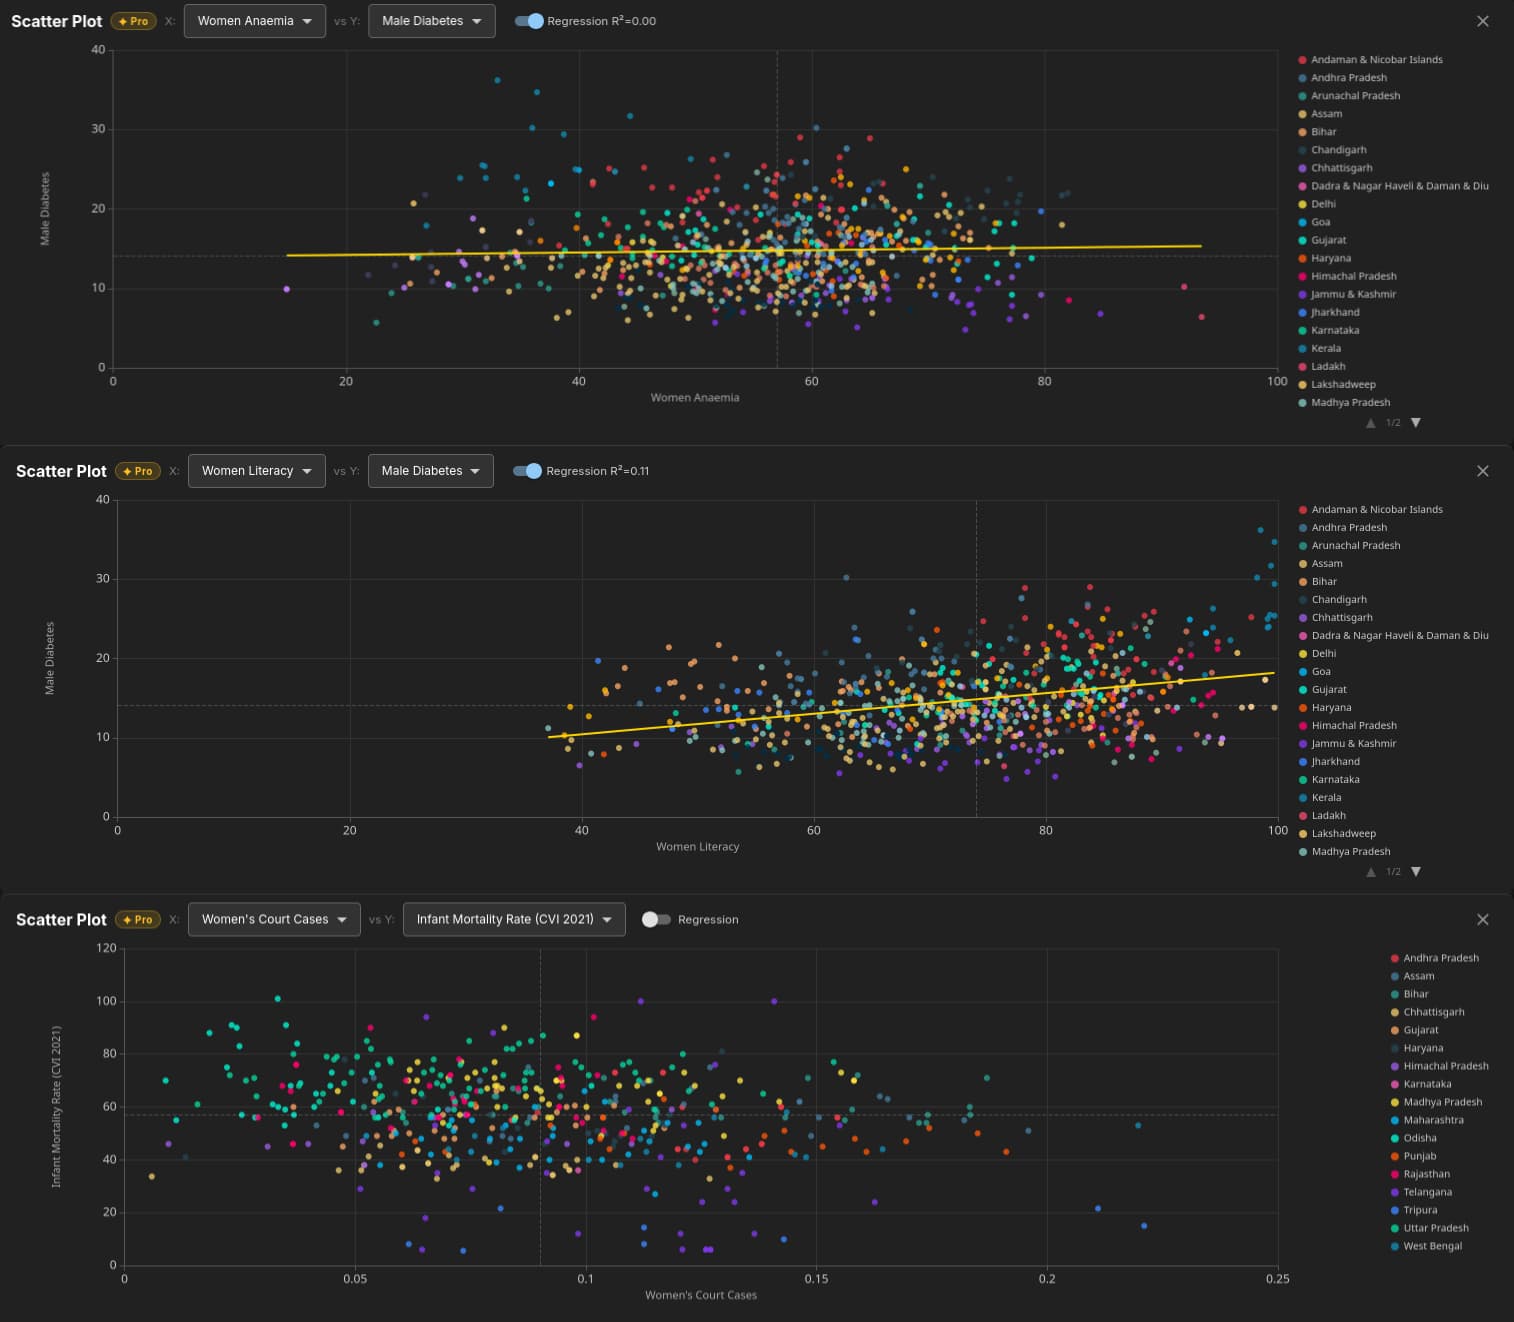
Scatter Plot (Cross-indicator Analysis)
Plot literacy against sex ratio. Night lights against urbanisation. Stunting against vaccination coverage. See which districts follow expected patterns — and which are outliers worth discussing in your answer. Regression line and R² included.
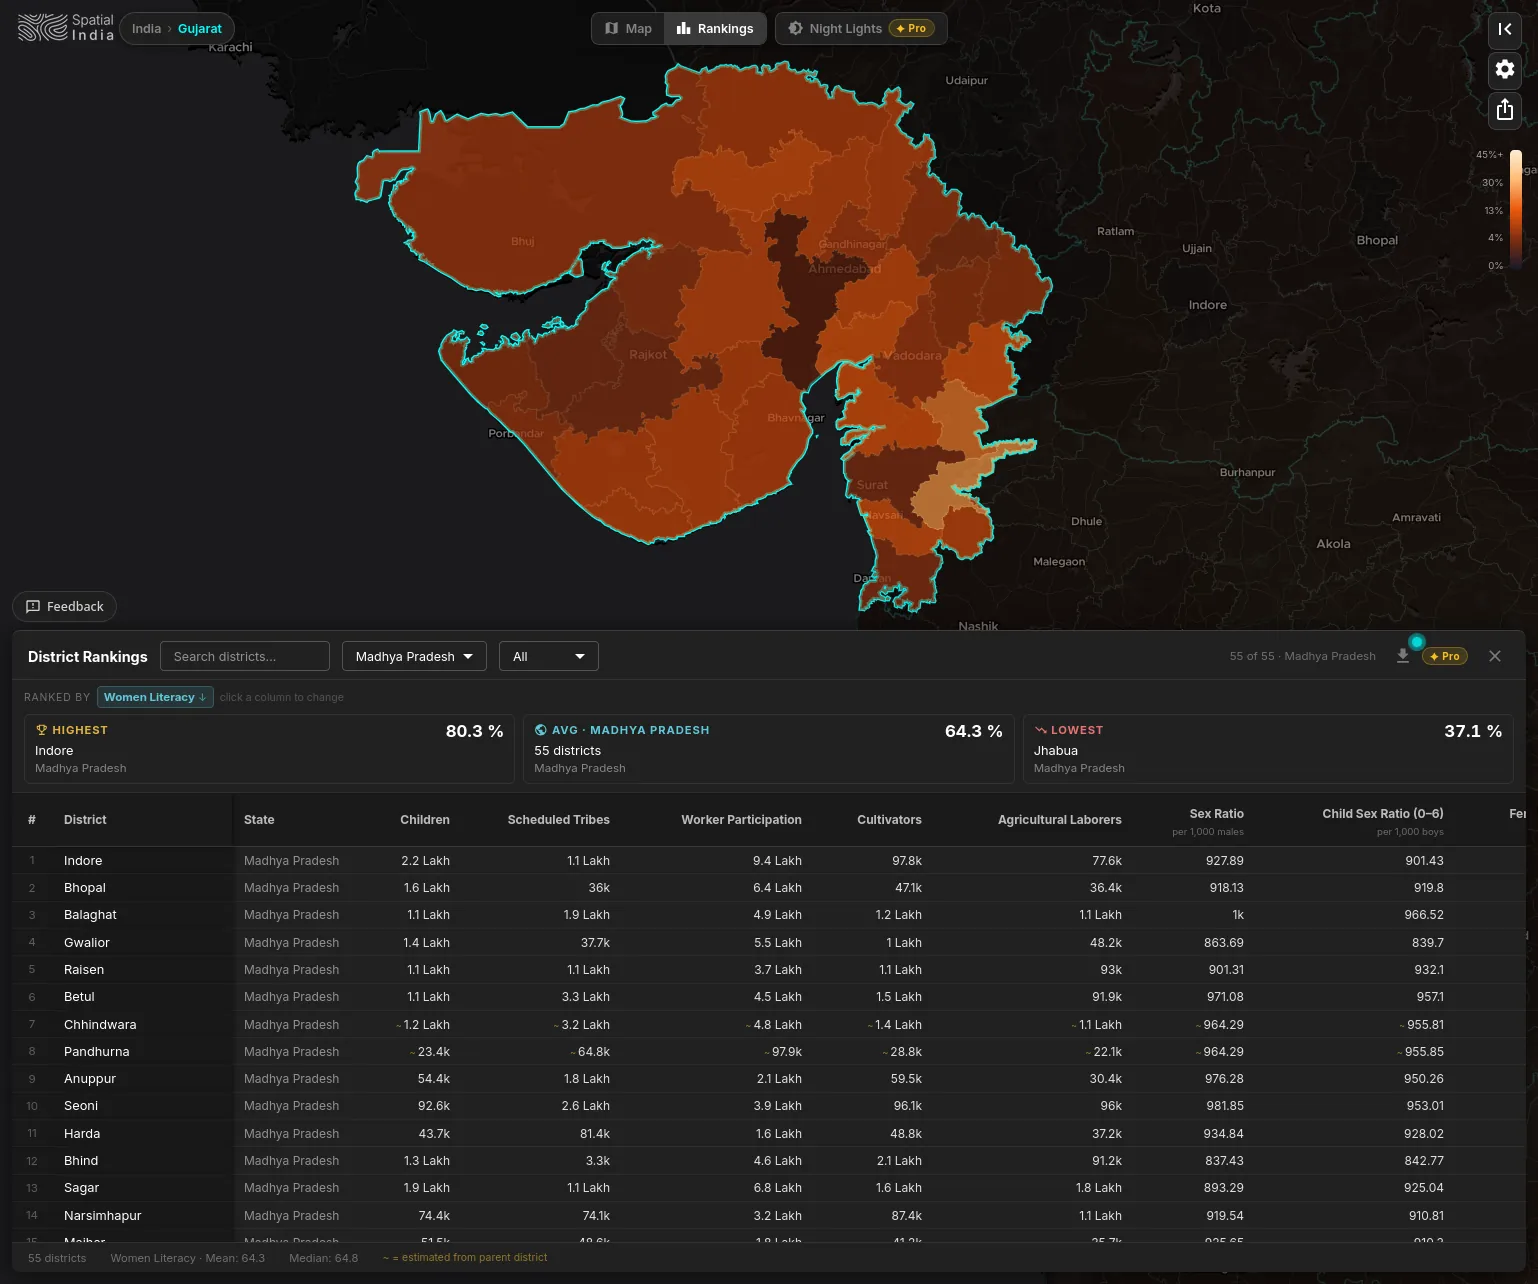
District Rankings (Data for Answer Writing)
Rank all 800+ districts by any indicator. "Top 10 most literate districts." "Bottom 50 on child stunting." "Districts with the worst sex ratio." Exact numbers with state and percentile context — ready for your answer sheets.
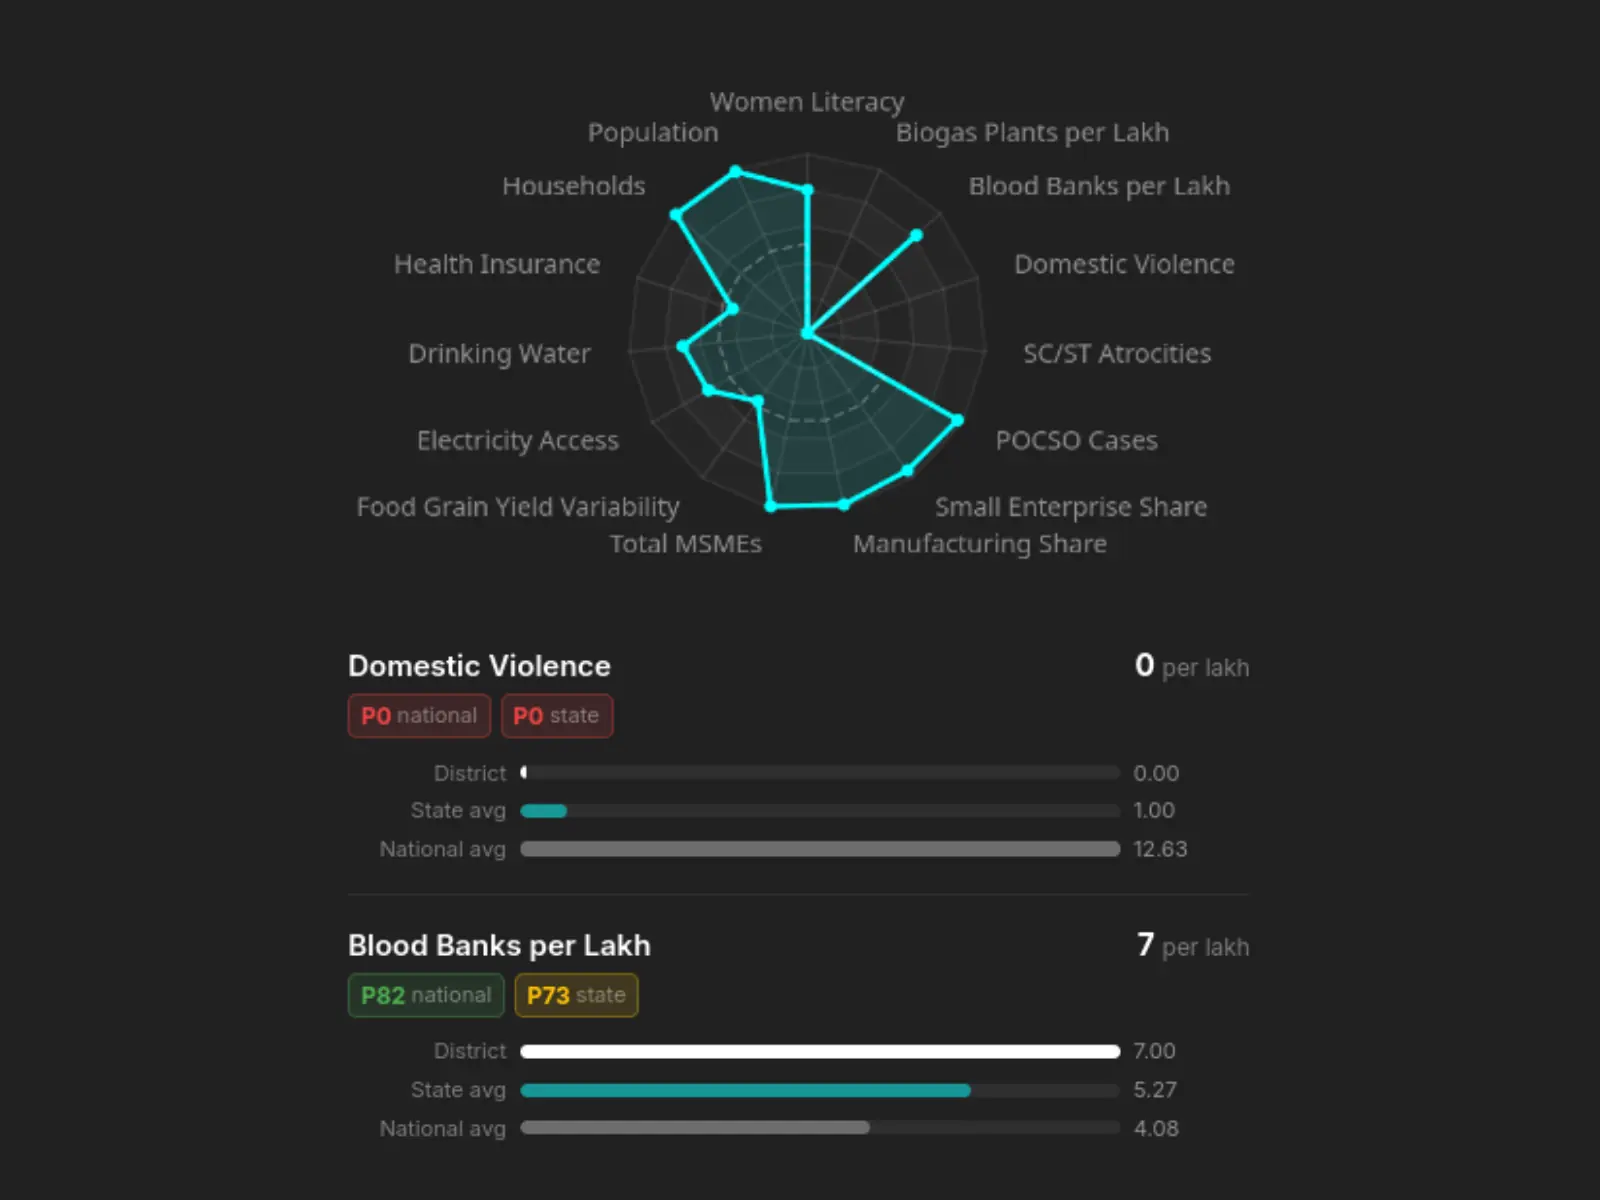
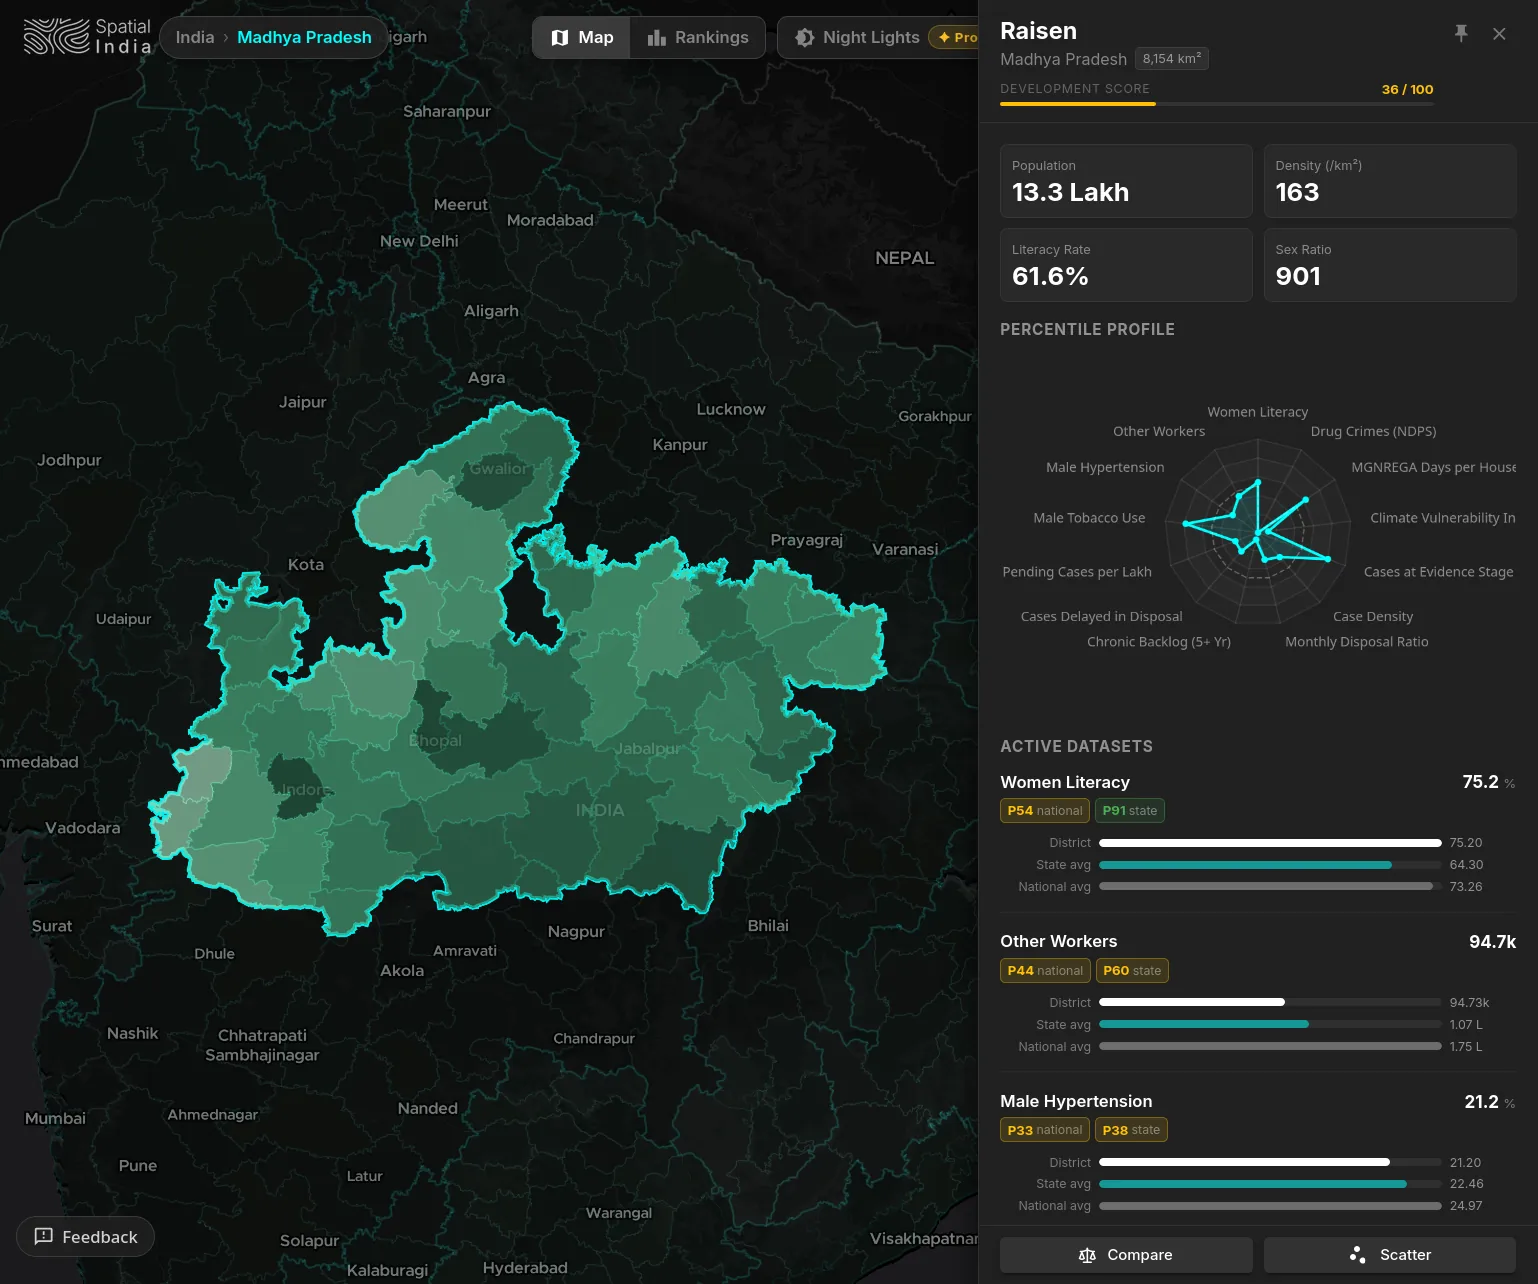
District Profile (Deep Dive)
Click any district to see its full statistical fingerprint: percentile radar across all active indicators, comparison bars against state and national averages, and a national distribution curve showing where it falls. Use it to build exam-ready examples — "Raisen district scores P91 state on literacy but P33 on hypertension."
MAPPED TO YOUR SYLLABUS
HOW THIS HELPS YOUR PREPARATION
GS-1 — Indian Geography & Demographics
Visualize population distribution, literacy gradients, urbanisation patterns, and tribal concentrations across all 800+ districts. See the spatial reality behind the data points you've memorised. For map-based questions and regional analysis essays.
GS-2 — Social Justice & Governance
Explore NFHS-5 health data (stunting, wasting, anemia), gender indicators (sex ratio, child marriage, female literacy gap), and governance metrics (judicial backlog). Identify the districts where development schemes are most needed — and least reaching.
Geography Optional — Spatial Patterns
Overlay night-time lights on population density. Compare climate vulnerability with agricultural land use. Use the scatter plot to find correlations between indicators. Build the kind of spatial reasoning that earns marks in Geography Optional papers.
BEYOND STATIC STUDY MATERIALS
| Feature | Textbook Maps | Coaching Materials | Online Data Tables | |
|---|---|---|---|---|
| Interactive district-level maps | Any indicator, one click | (static, ~5 maps) | (static PDFs) | |
| 85+ indicators across the syllabus | GS-1, GS-2, GS-3 & Geo Optional | (~5 indicators) | (~10–15 indicators) | (scattered across sites) |
| Cross-indicator pattern discovery | Scatter plot, bivariate, correlation | |||
| Night-time lights economic layer | NASA VIIRS 2015–2024, annual | |||
| State drill-down & intra-state comparison | Click any state, rank its districts | |||
| District-level granularity (800+) | Every district, every indicator | (state-level only) | (state-level only) | (partial) |
| Current data sources (NFHS-5, VIIRS 2024) | Multi-source, regularly updated | (outdated editions) | (varies by batch) | (partial) |
| Works in your browser, zero setup | No app, no login, start now | |||
| Census 2027 ready | New data, day-one support |
Spatial India vs Textbook Maps
Spatial India vs Coaching Materials
Spatial India vs Online Data Tables
How to use this for answer writing
- Pick an indicator relevant to your next Mains paper (e.g., sex ratio for GS-2 Social Justice)
- Explore the map — note the regional pattern, the outlier districts, and the state-level variation
- Use the scatter plot to connect two indicators (e.g., female literacy vs child sex ratio) — the correlation IS your analysis paragraph
Stop memorising tables. Start seeing patterns.
Free to explore. No signup, no login. Spend 15 minutes with the map before your next answer writing session — you'll see the difference.