India's Spatial Intelligence Platform
The most powerful platform for visualizing the data, communities, and geographies that shape India.
Features
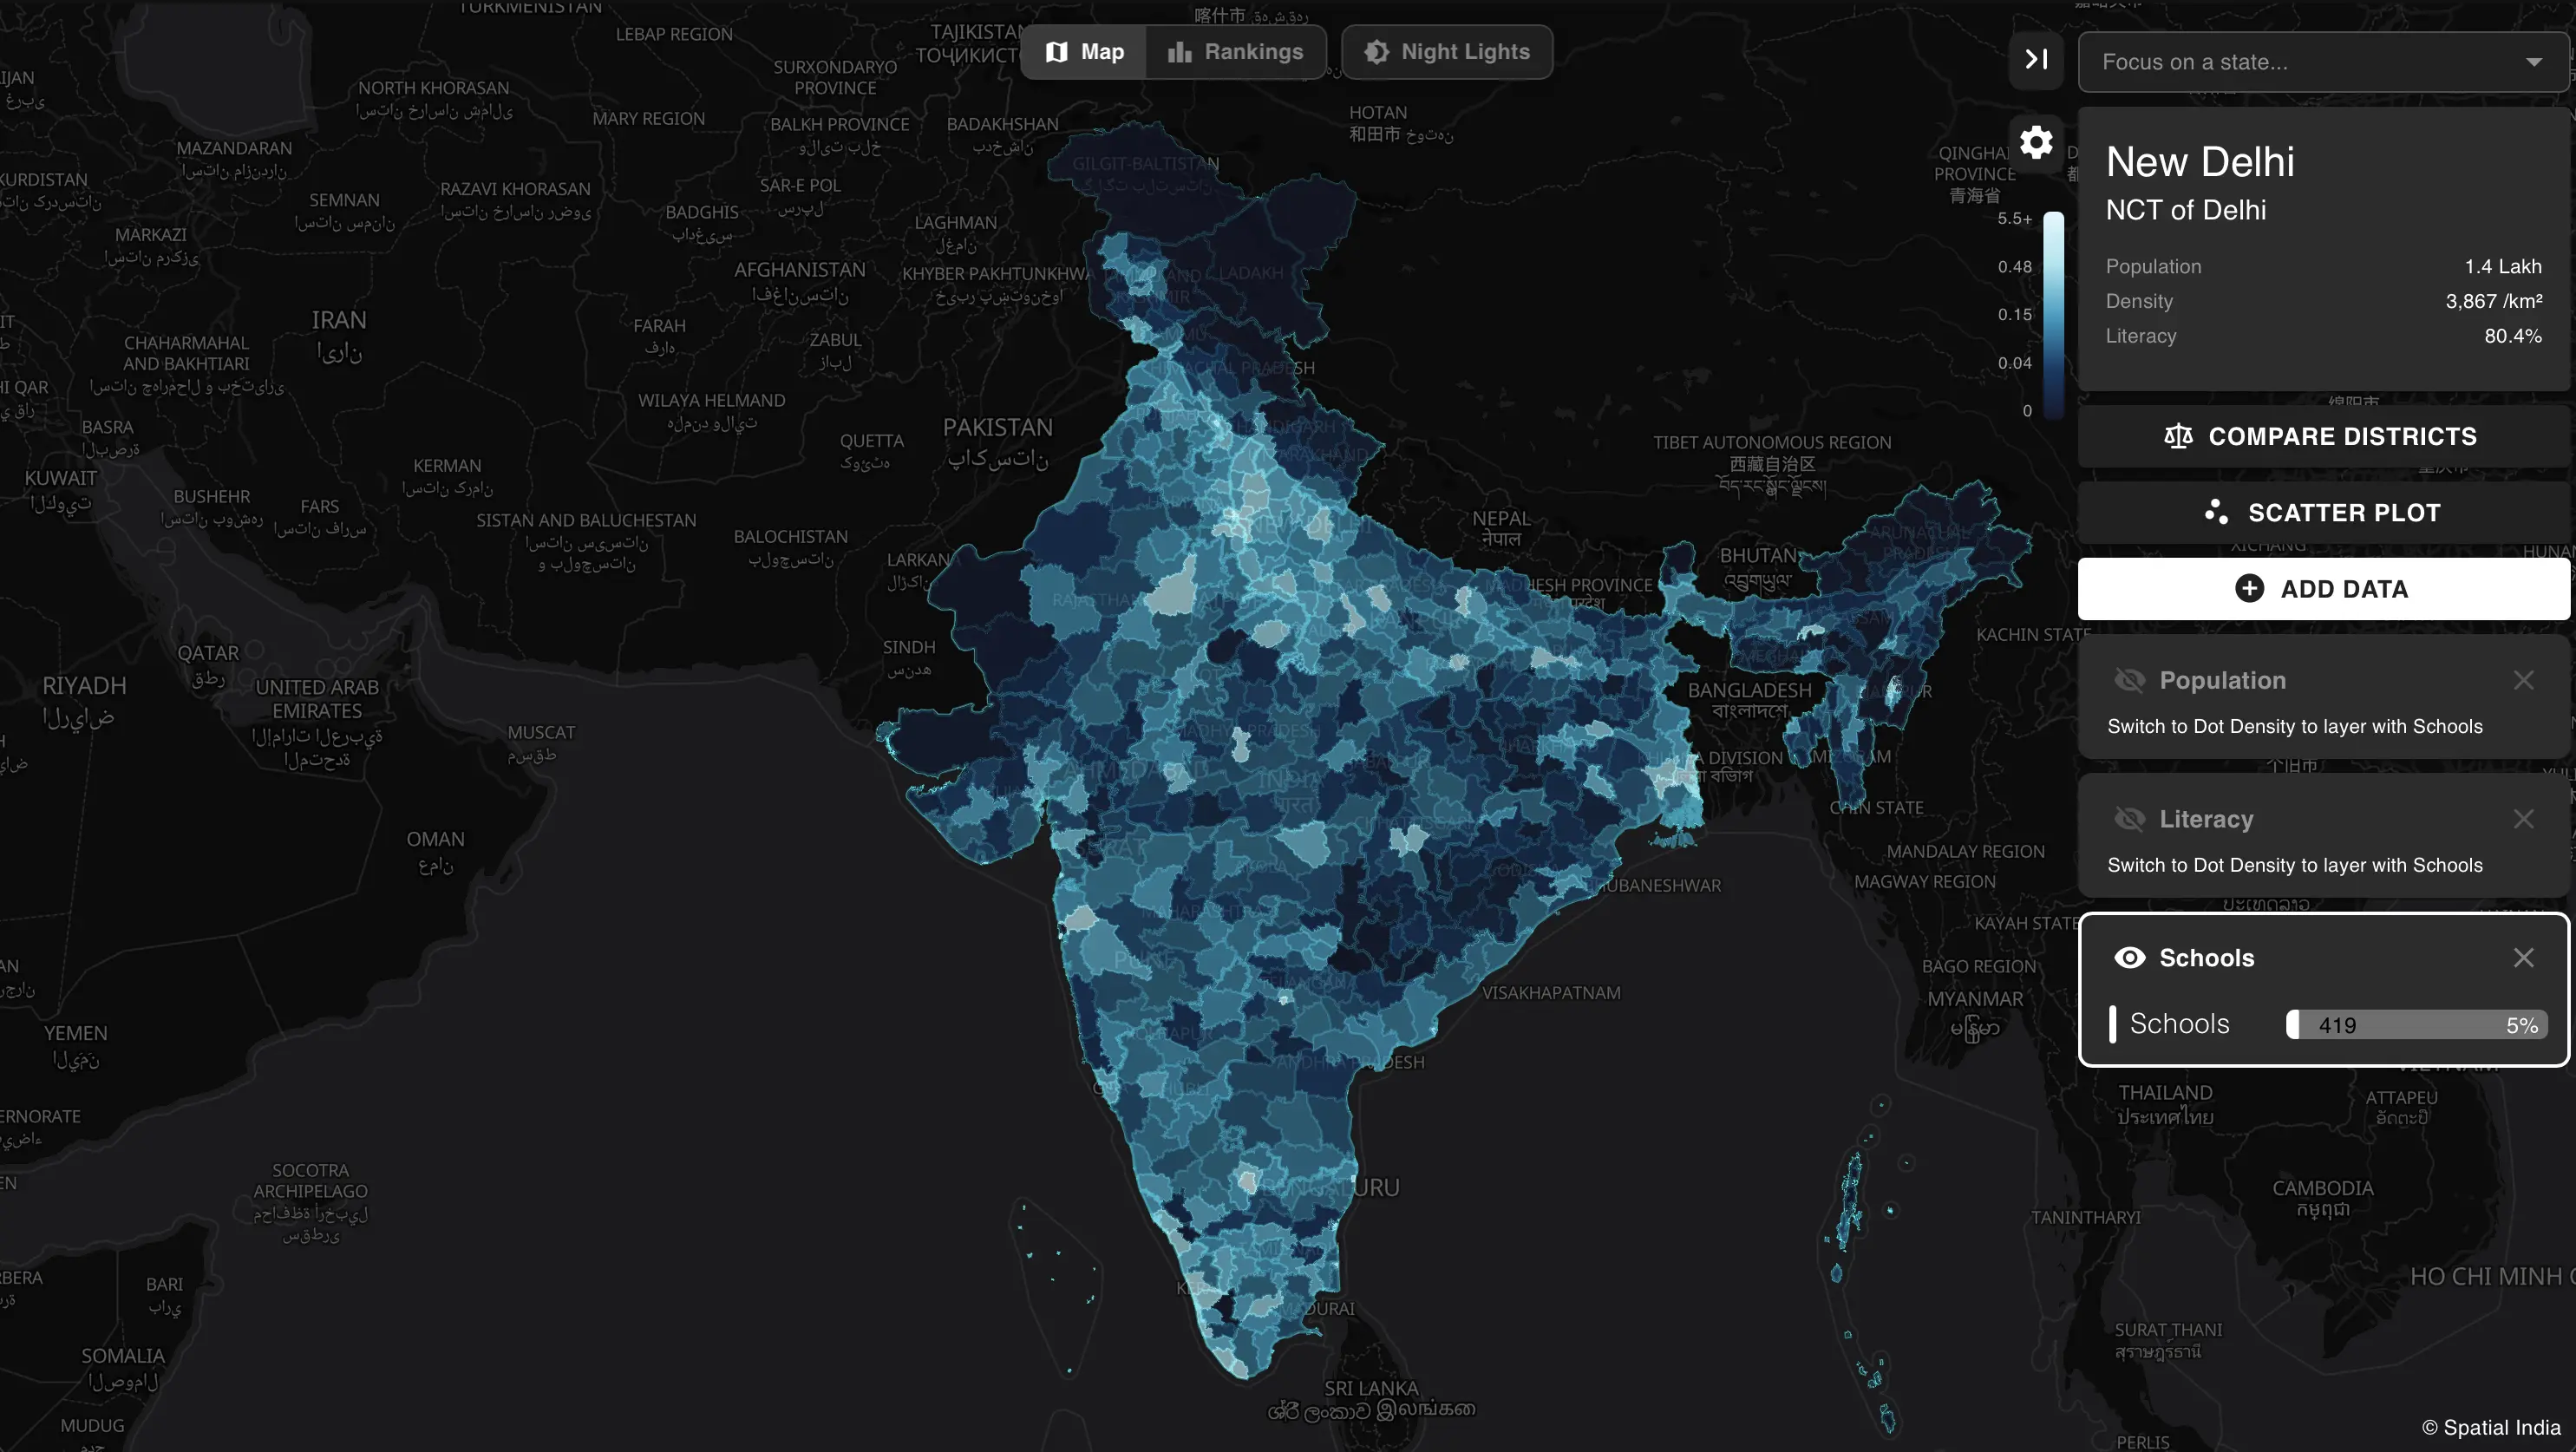
CHOROPLETH MAPPING
See Every District at Once
Layer 85+ indicators from 10+ national sources across every district. See demographics, health, agriculture, climate vulnerability, and more as rich colour gradients.
CHOROPLETH MAPPING
See Every District at Once
Layer 85+ indicators from 10+ national sources across every district. See demographics, health, agriculture, climate vulnerability, and more as rich colour gradients.
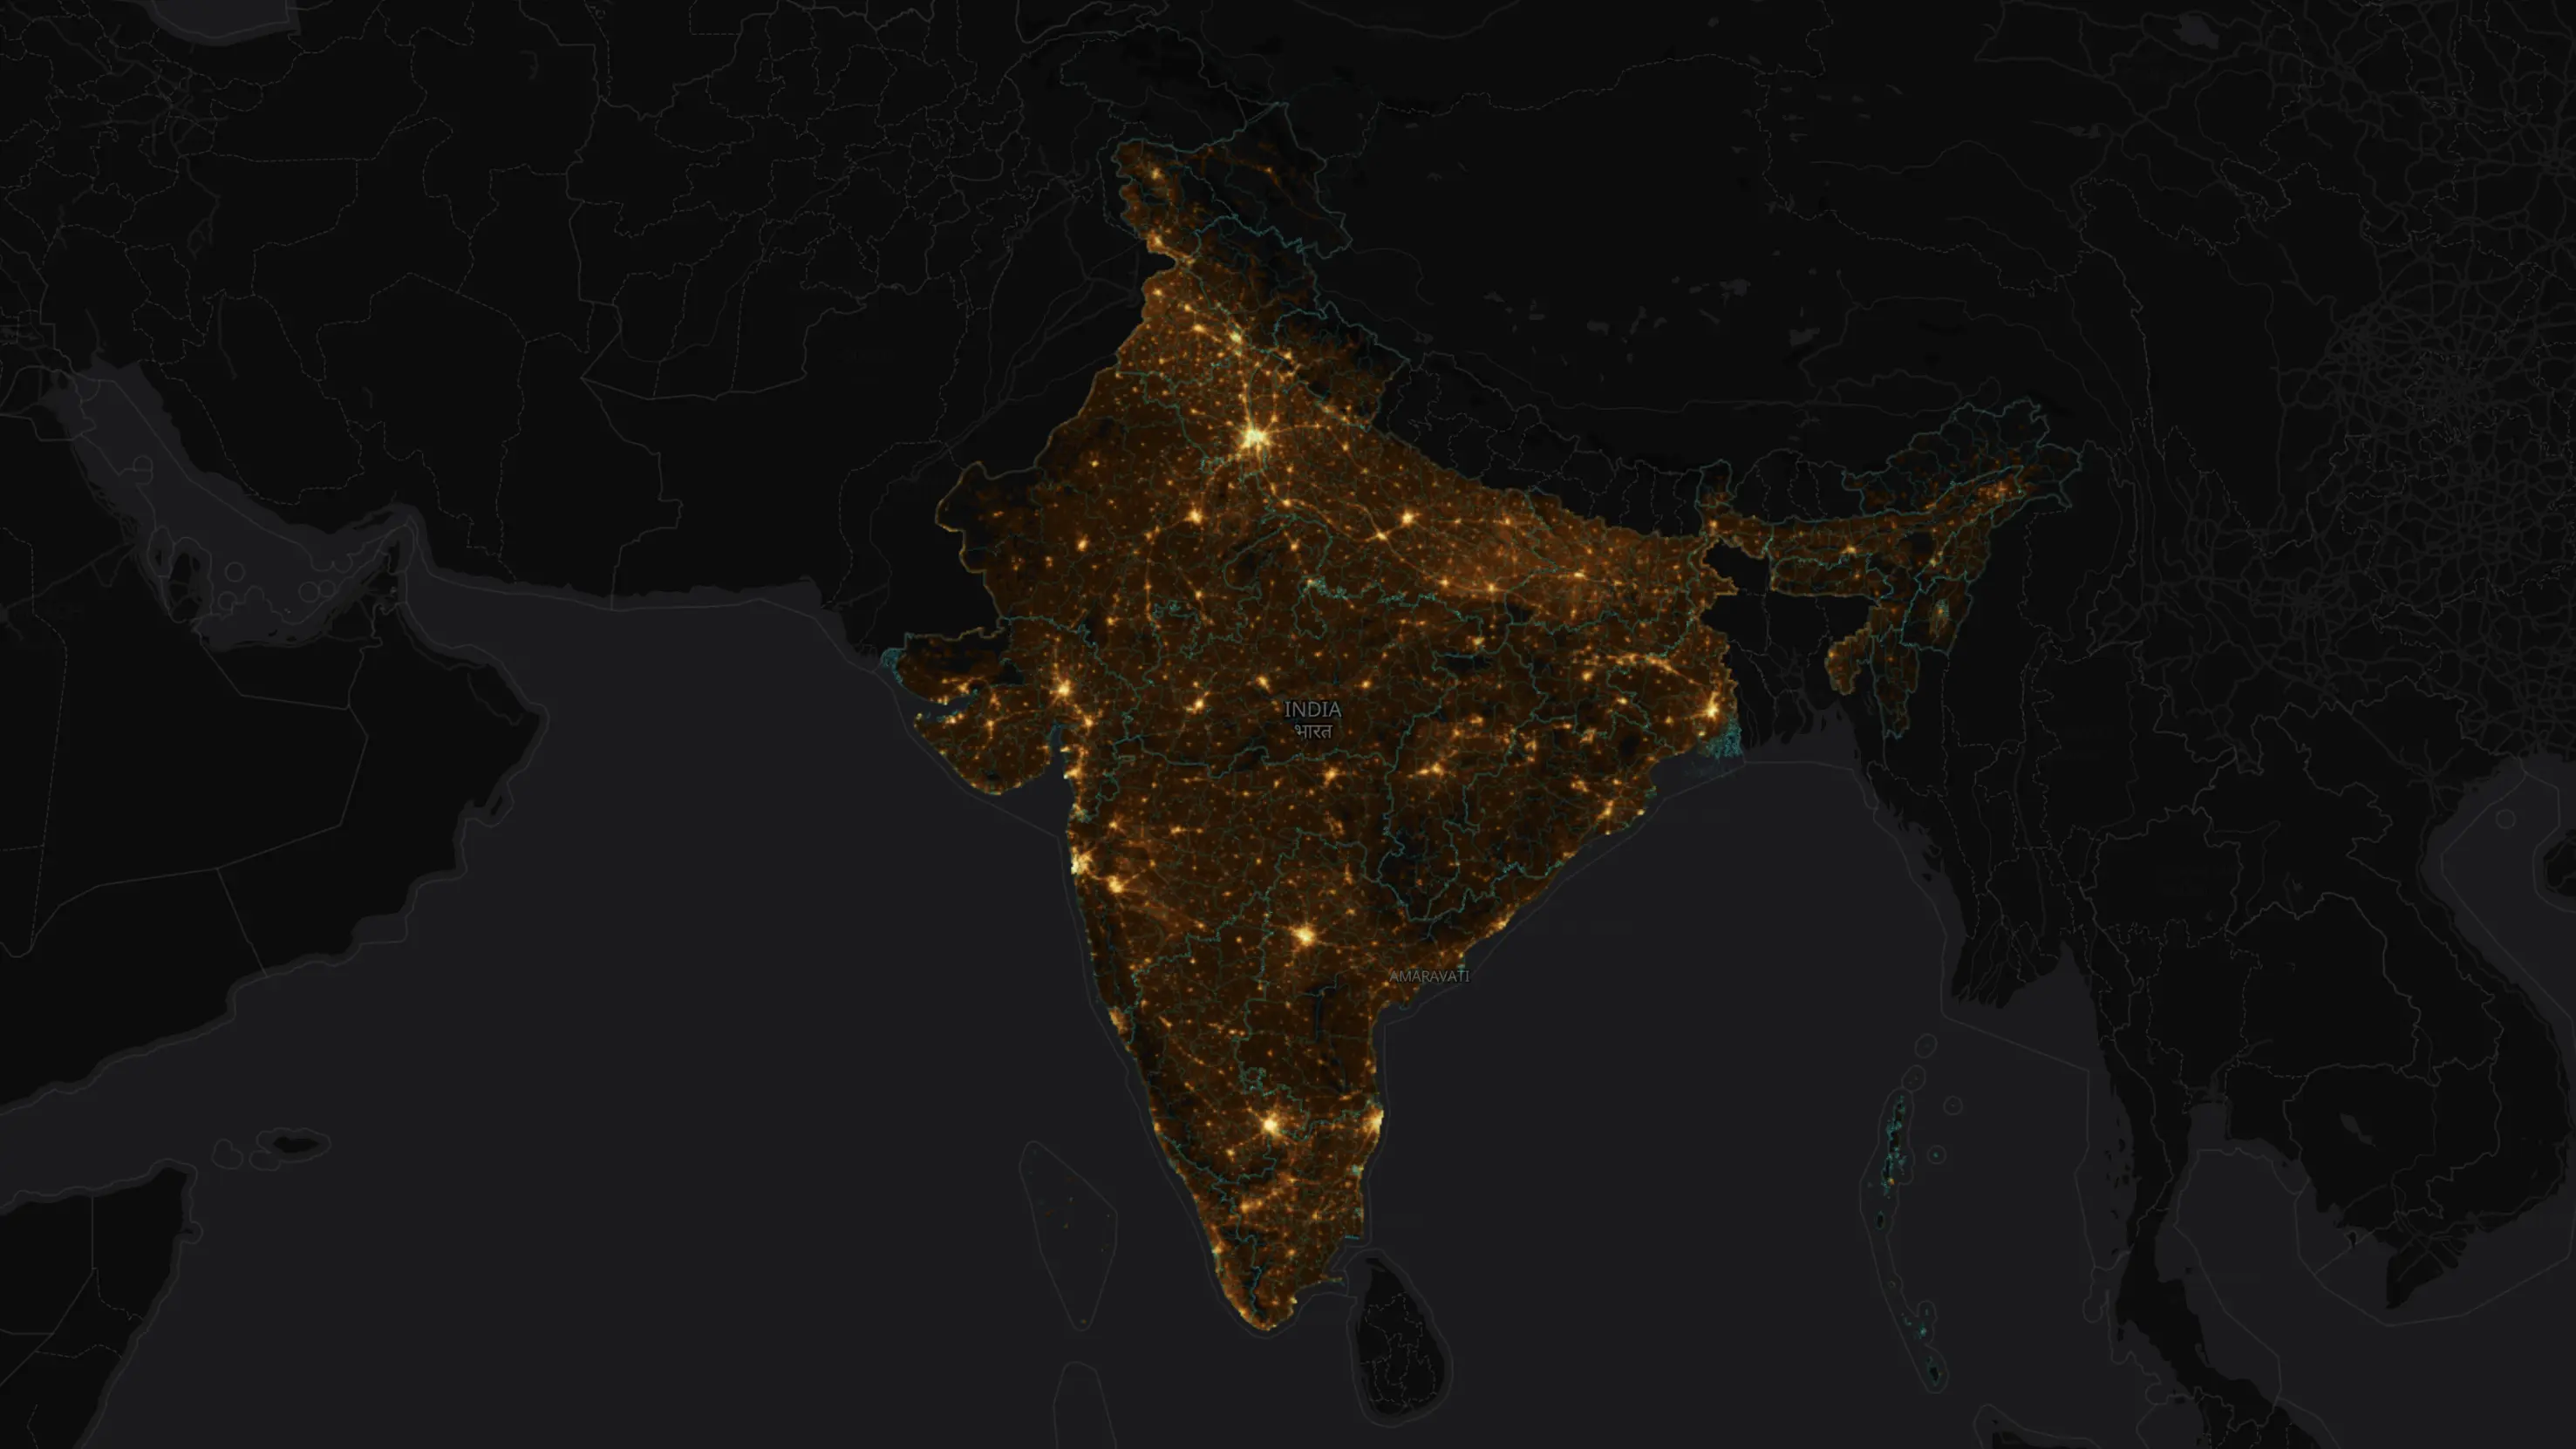
NIGHT-TIME LIGHTS
Correlate Light with Life
Overlay 2024 VIIRS satellite imagery to correlate economic activity with demographic data — a layer unavailable in any other India mapping tool.
NIGHT-TIME LIGHTS
Correlate Light with Life
Overlay 2024 VIIRS satellite imagery to correlate economic activity with demographic data — a layer unavailable in any other India mapping tool.
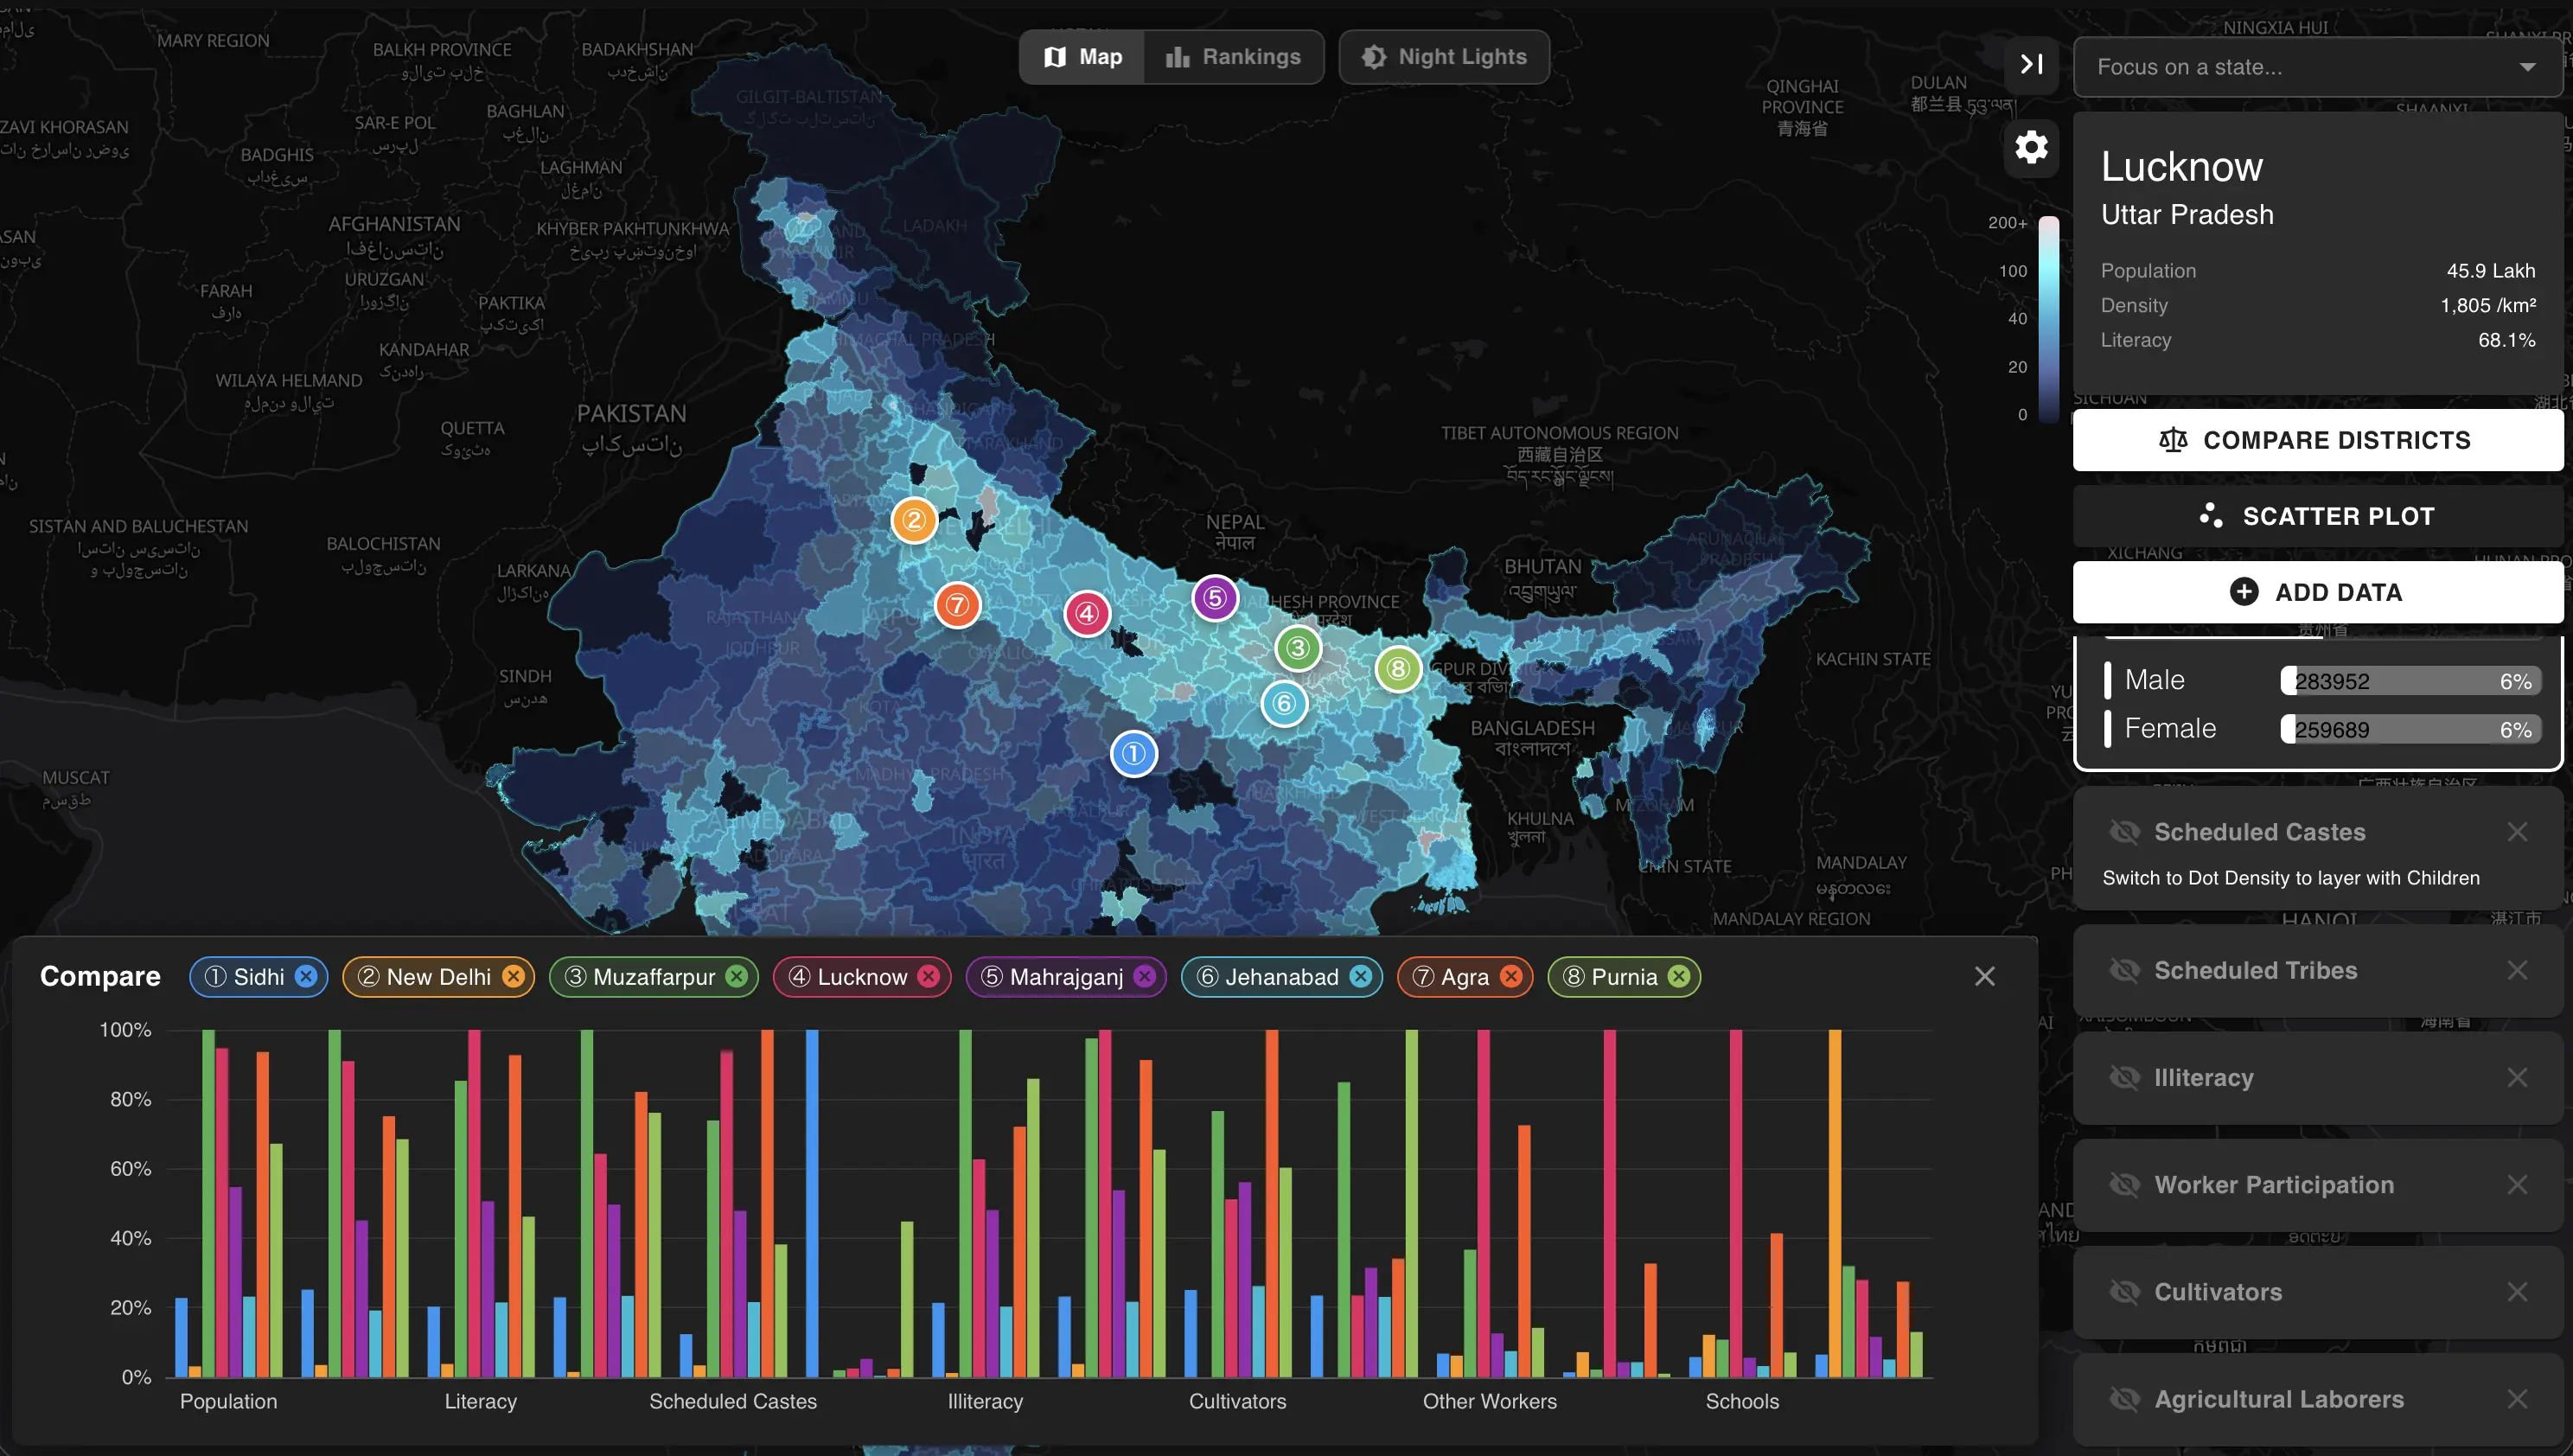
DISTRICT COMPARISON
Compare Any Districts, Instantly
Pin any districts across India and compare them across every metric side-by-side in a single chart — answers in seconds, not spreadsheets.
DISTRICT COMPARISON
Compare Any Districts, Instantly
Pin any districts across India and compare them across every metric side-by-side in a single chart — answers in seconds, not spreadsheets.

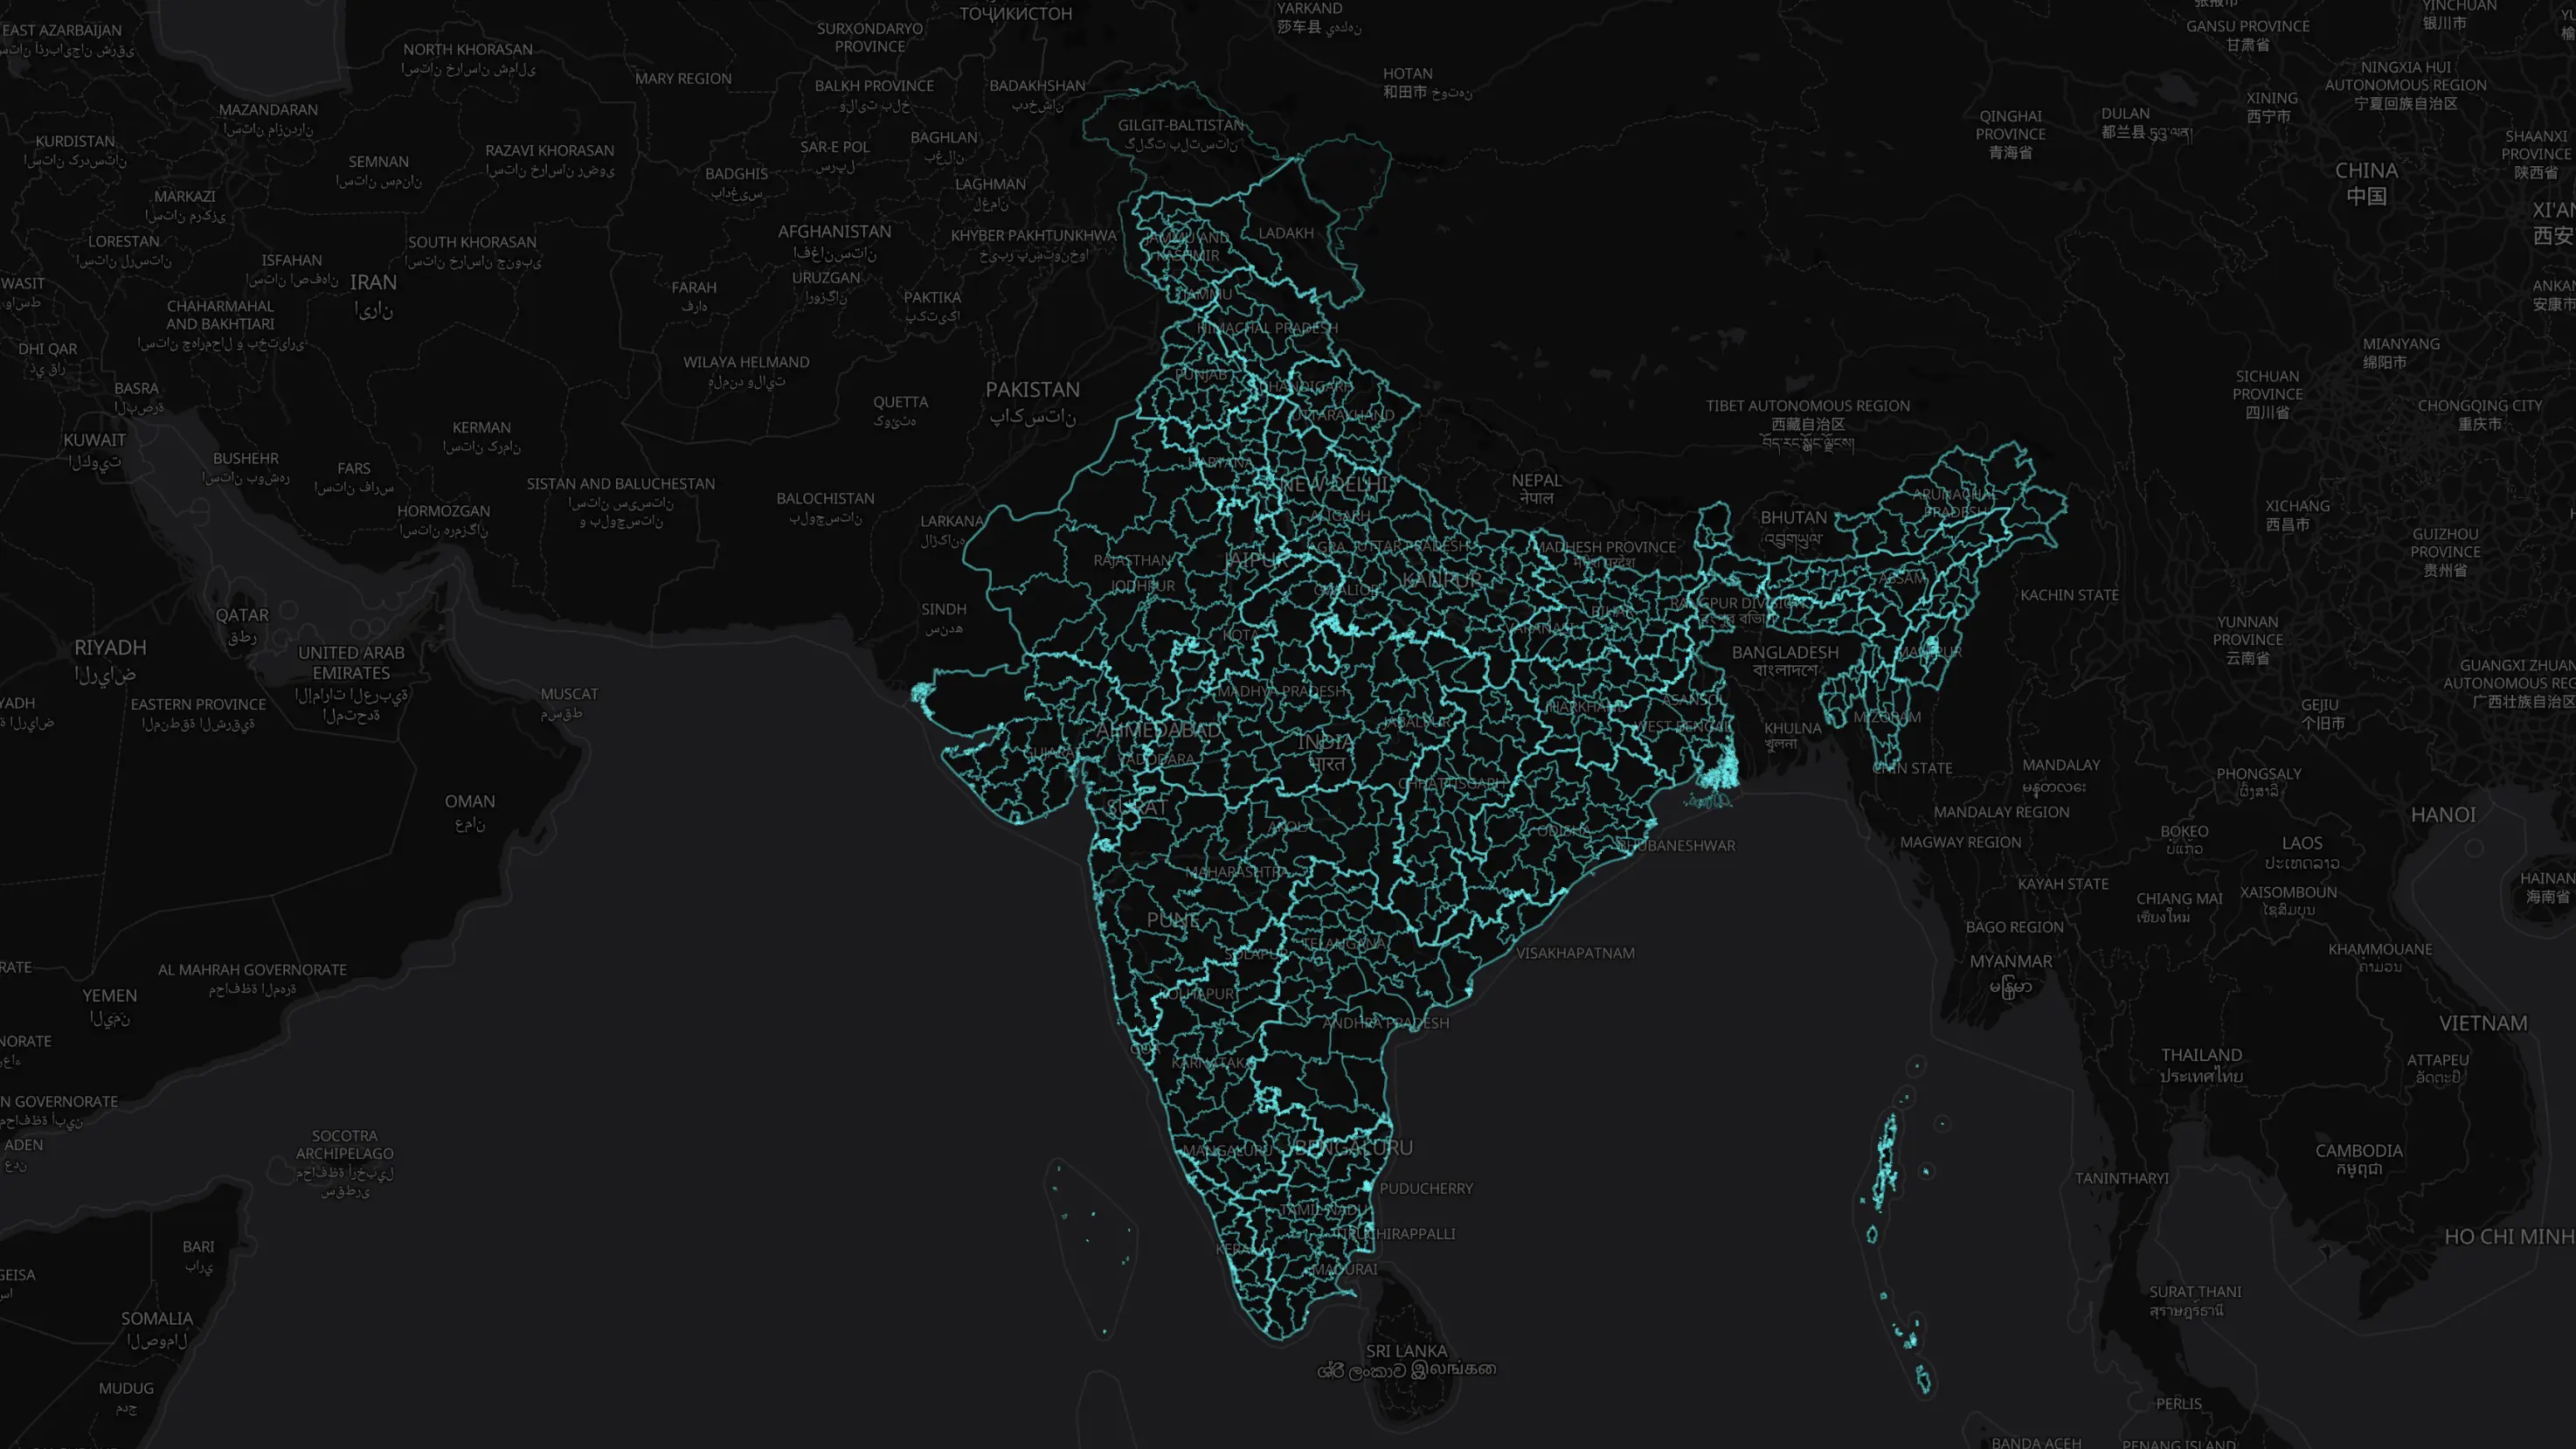
BUILDING FOOTPRINTS
Zoom Into Urban Density
Drill into street-level building footprints for any district. Visualize urban density patterns that no census table can convey.
BUILDING FOOTPRINTS
Zoom Into Urban Density
Drill into street-level building footprints for any district. Visualize urban density patterns that no census table can convey.
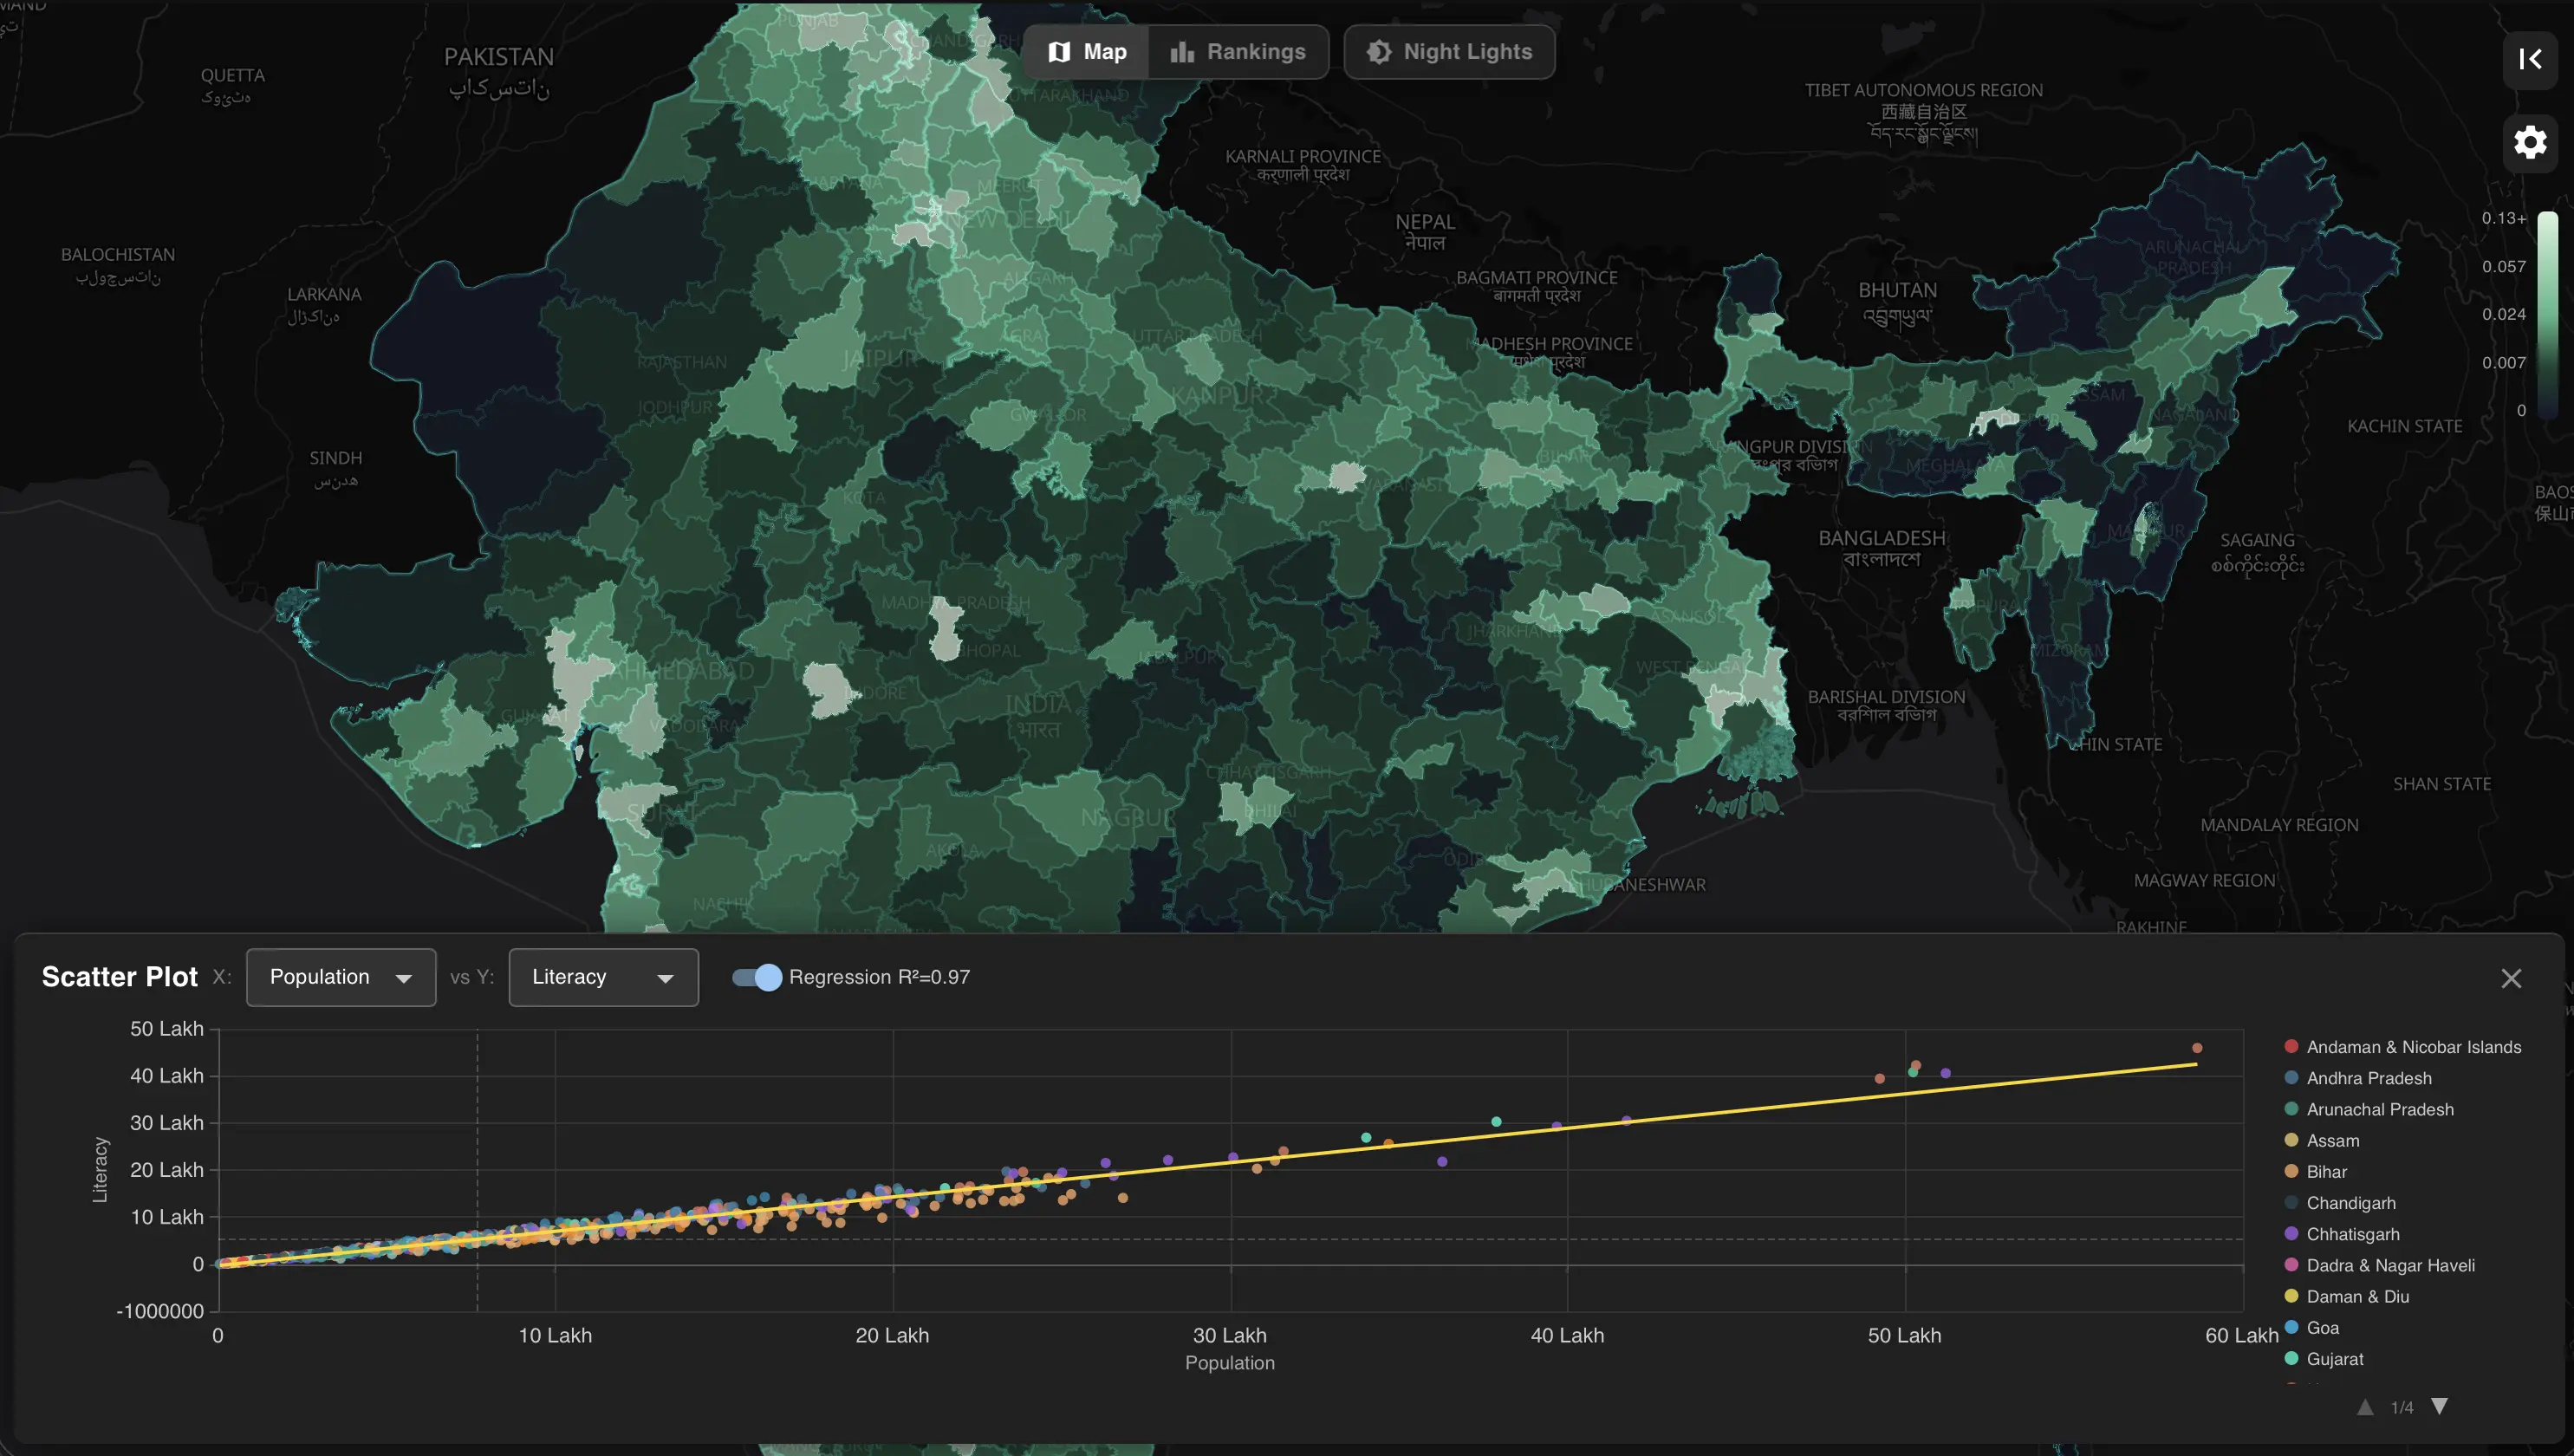
SCATTER PLOT ANALYSIS
Uncover Hidden Correlations
Reveal correlations between any two metrics across all 800+ districts. Spot outliers and regional clusters with a built-in regression line.
SCATTER PLOT ANALYSIS
Uncover Hidden Correlations
Reveal correlations between any two metrics across all 800+ districts. Spot outliers and regional clusters with a built-in regression line.
Built for Every Question
Explore what's possible with your spatial toolkit
FAQ
Frequently Asked Questions
• Development & NGOs — target programs, map impact, and generate district-level visuals for grant reports
• Consulting & Market Research — size markets, identify white-space districts, and build data-backed expansion strategies
• Banking & Financial Services — spot underbanked regions, plan branch networks, and assess district-level economic activity
• Media & Academia — create publication-ready maps, explore demographic patterns, and power data-driven stories
• Government & Policy — allocate resources, benchmark districts, and track development indicators across states
Something else? We're always listening — suggest a feature or use case at hello@spatialindia.com.
Join our early access list below to be notified when it goes live!
Stay in the loop
Be the first to explore Census 2027 data.
Get early access, new datasets, & India data stories — directly to your inbox.