SPATIAL INDIA FOR GOVERNMENT & POLICY
Evidence-grade district intelligence for better policy
Benchmark any district against state and national averages across demographics, health, education, infrastructure, and economic indicators. 85+ development metrics from 10+ authoritative sources — integrated, interactive, and ready for evidence-based planning.
THE GOVERNANCE DATA GAP
Data scattered across ministries and portals
Health indicators sit on NFHS. Education data is on UDISE+. Economic metrics are on separate dashboards. Agricultural data is at agcensus.nic.in. No single platform brings all district-level development data together for cross-sectoral analysis.
State-level dashboards hide district-level reality
NITI Aayog's SDG Index ranks states — but the real variation is between districts. Bihar's best district outperforms the national average on several metrics. State-level views mask the districts that need targeted intervention.
Review meetings run on static Excel tables
District Collectors and BDOs present development data in static tables and PDF slides. No interactive exploration, no spatial patterns, no ability to compare districts during the meeting itself.
TOOLS FOR EVIDENCE-BASED GOVERNANCE
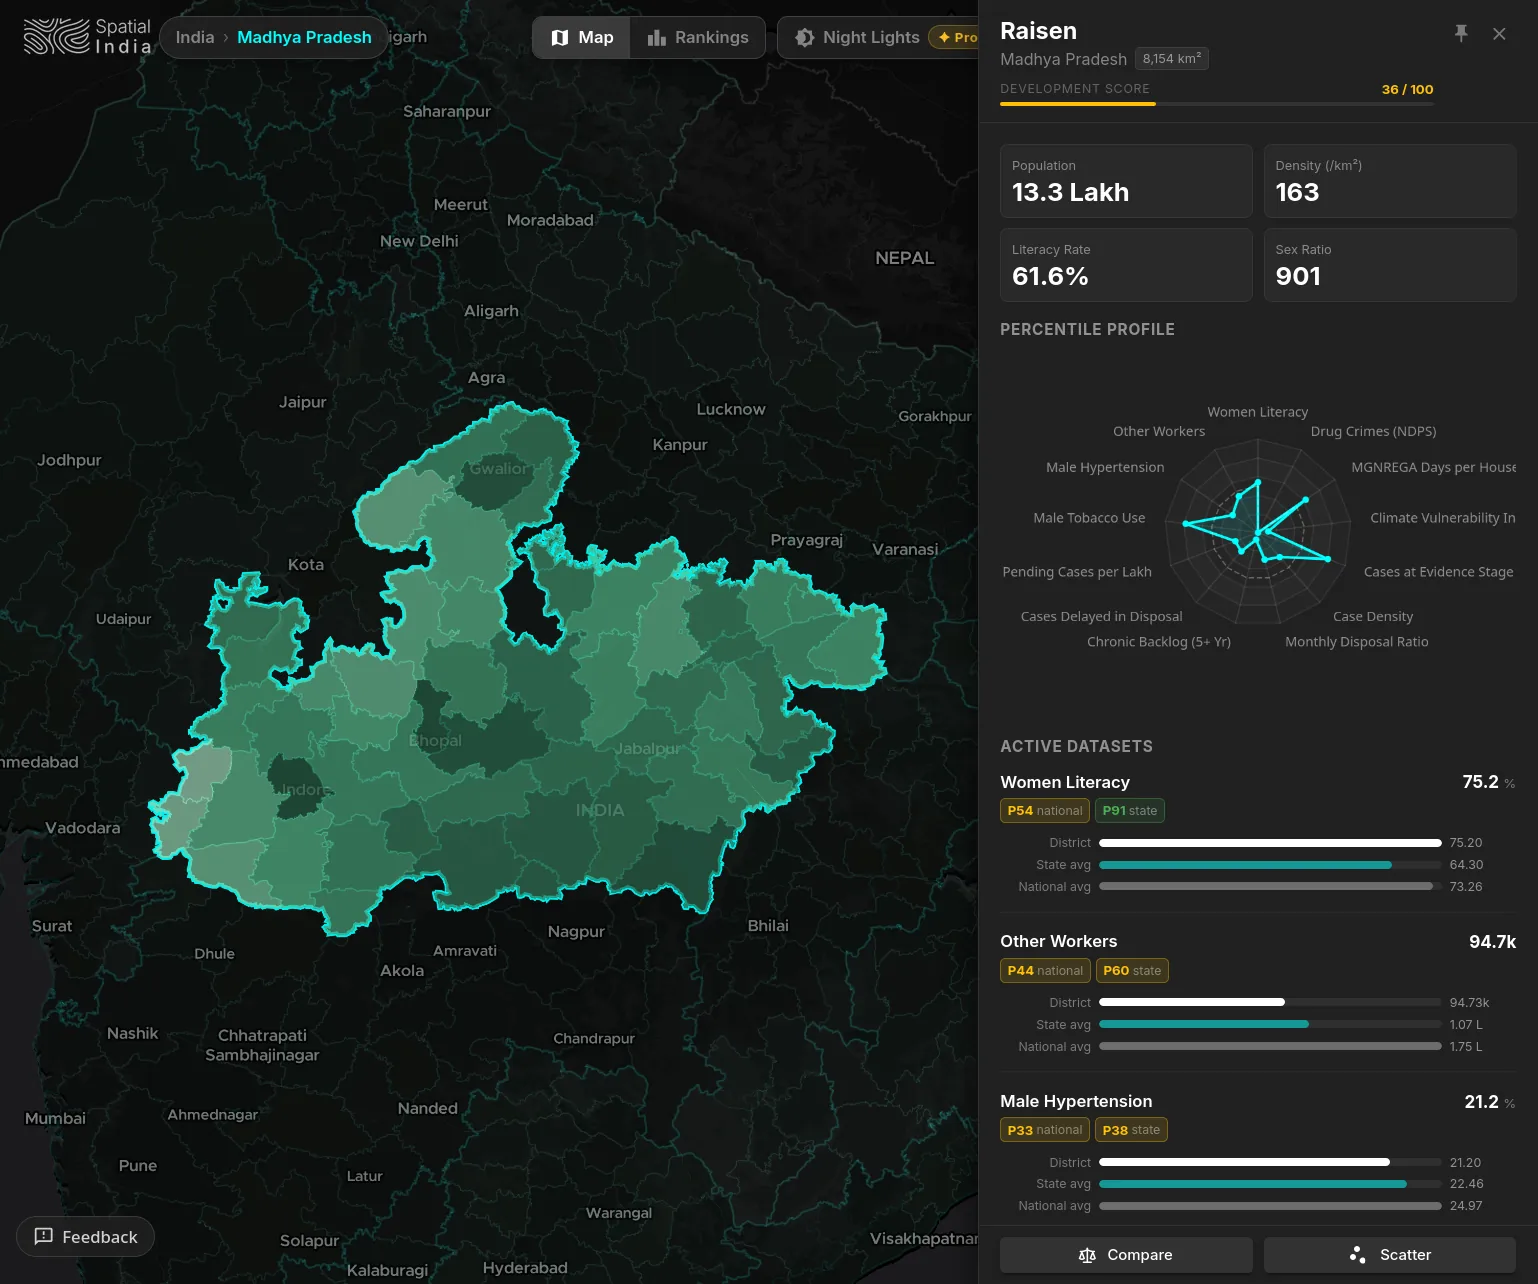
State Focus & Drill-Down
Click any state to zoom in and see all its districts. Compare district performance within the state across health, education, workforce, and infrastructure. See state averages against national benchmarks at a glance.
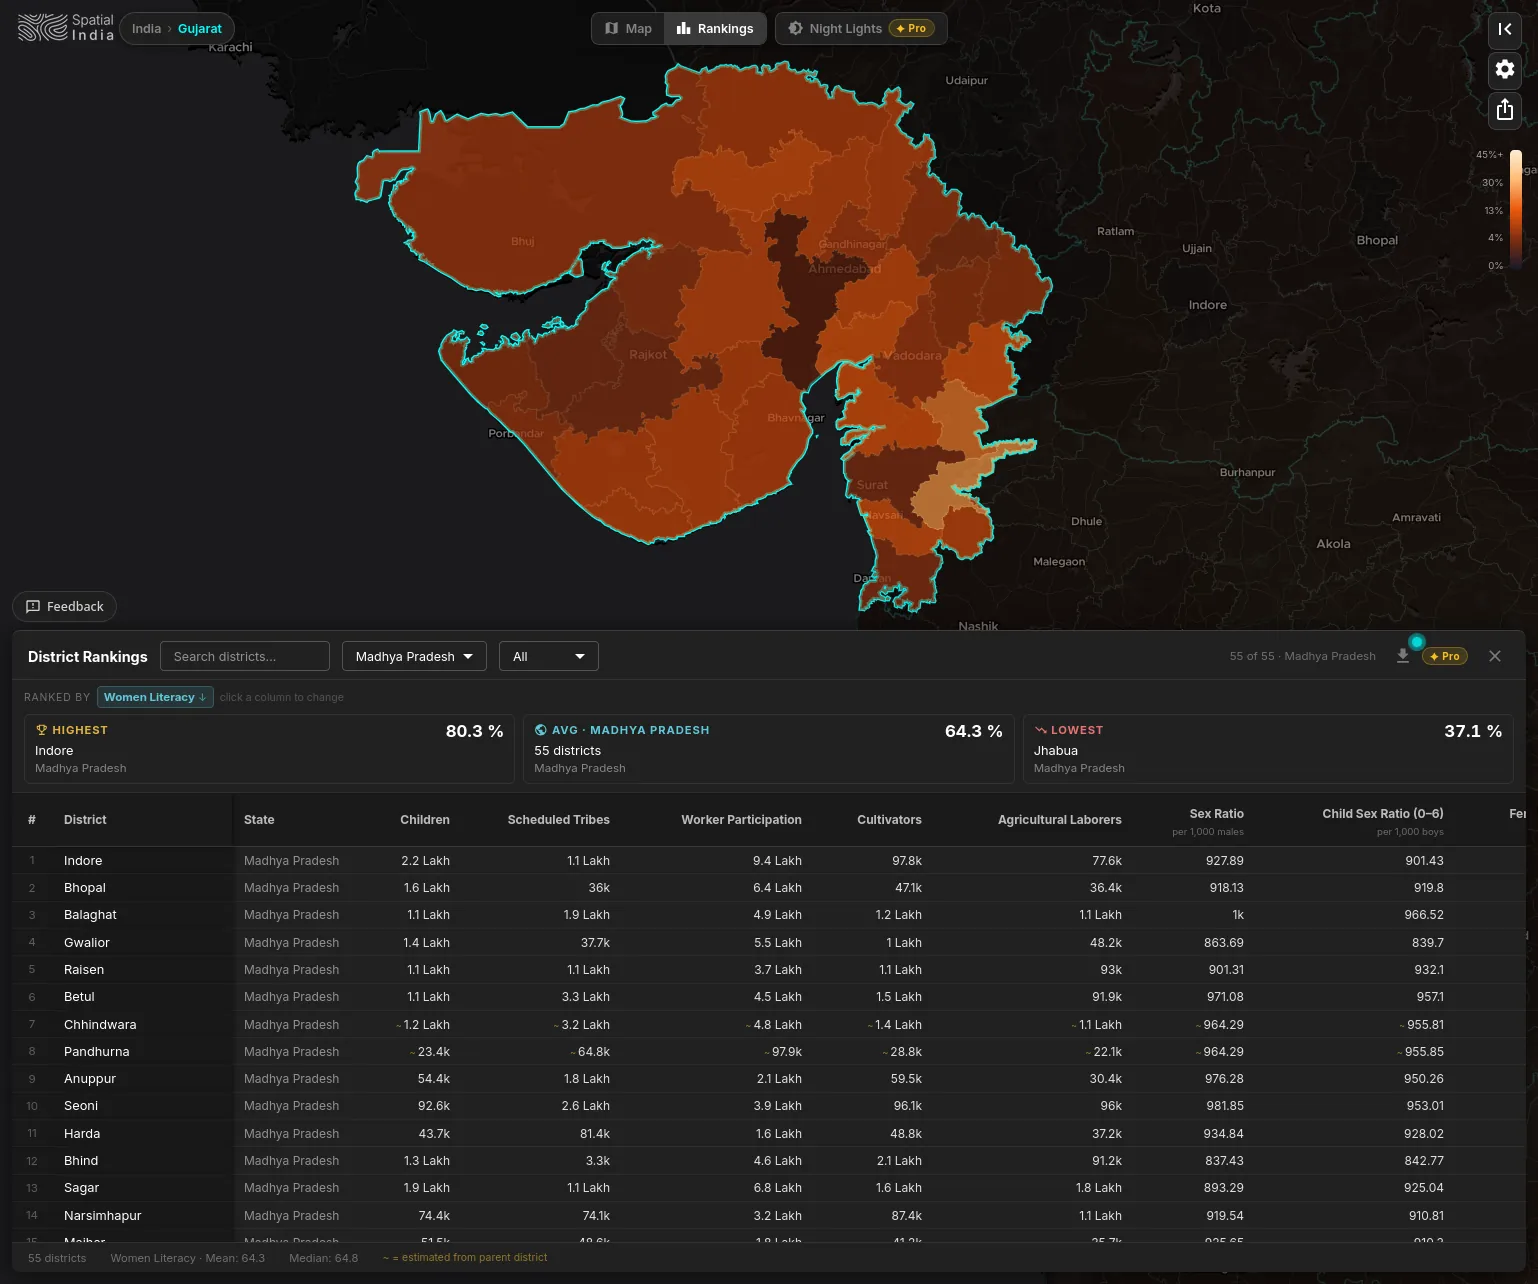
District Rankings
Rank all 800+ districts by any development indicator. Filter by state. Identify the bottom 50 on stunting, the top 25 on literacy, or the most underserved districts on sanitation — evidence-ready for scheme review meetings.
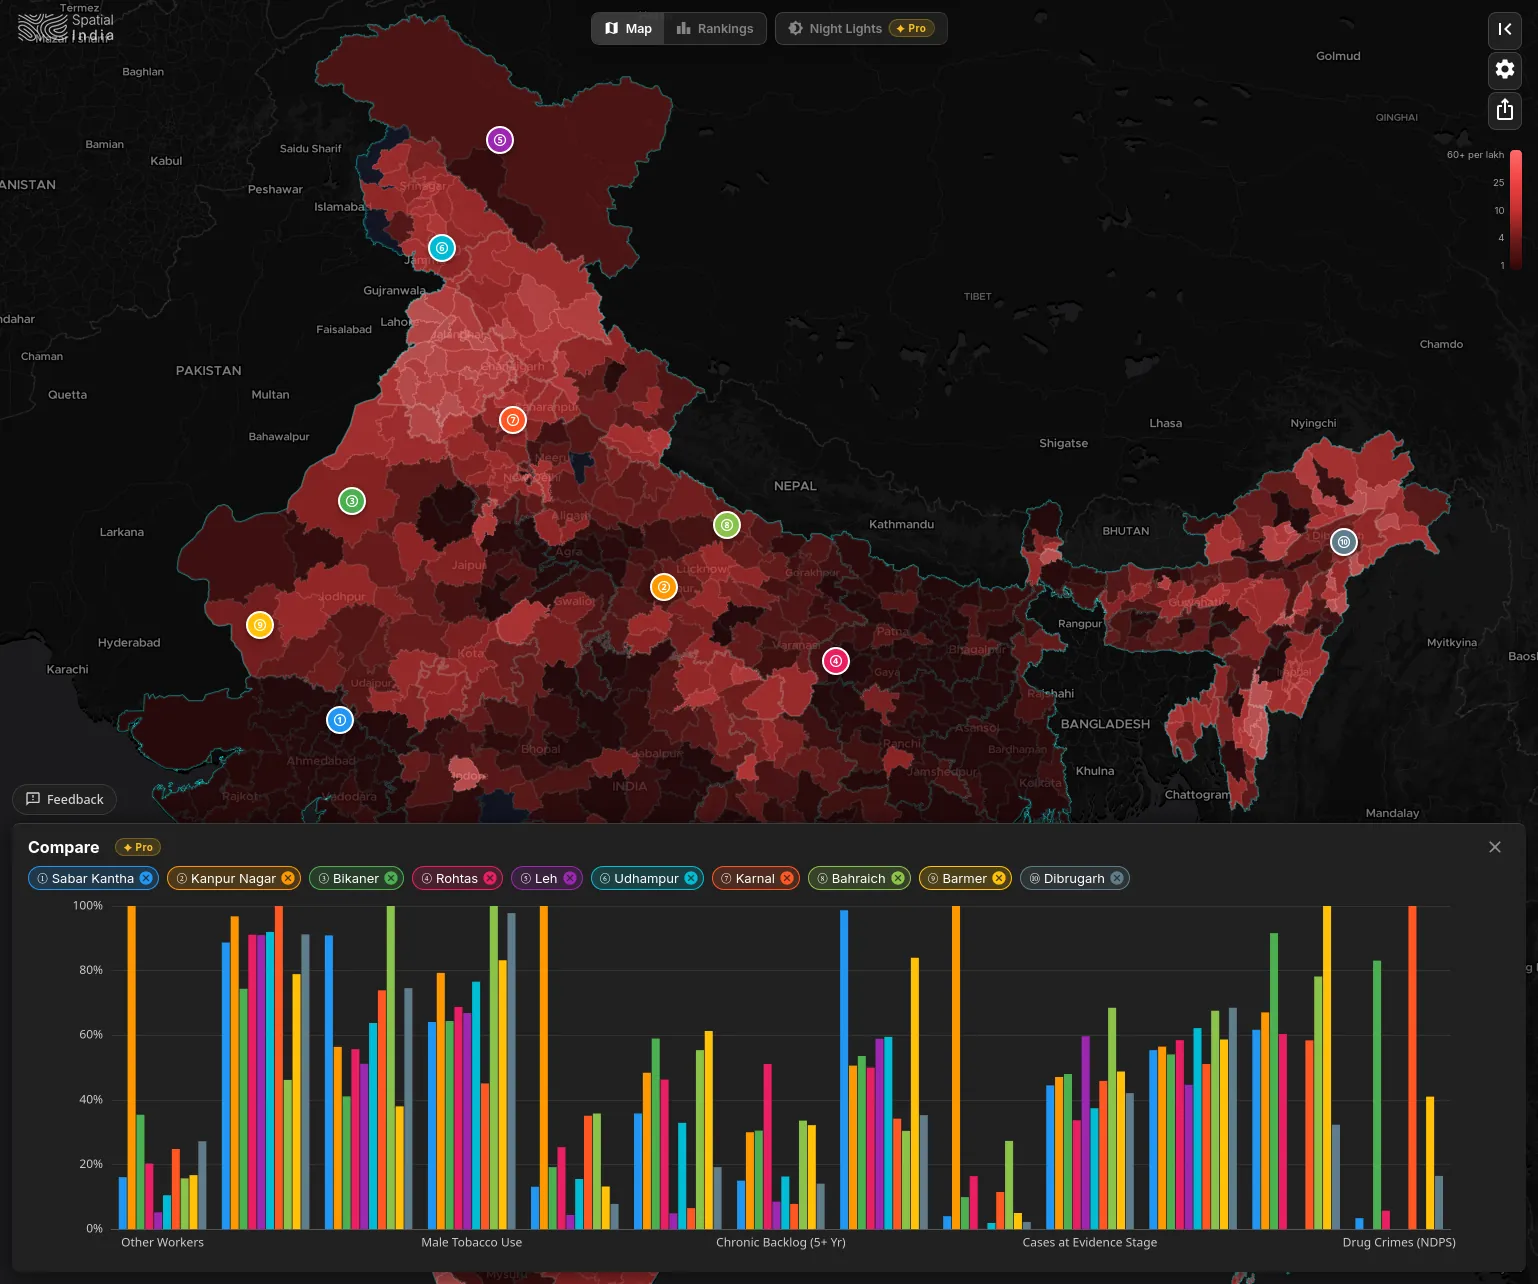
District Comparison Panel
Pin any combination of districts and compare them across every active indicator in a single normalised chart. See which aspirational districts are improving and which need targeted intervention.
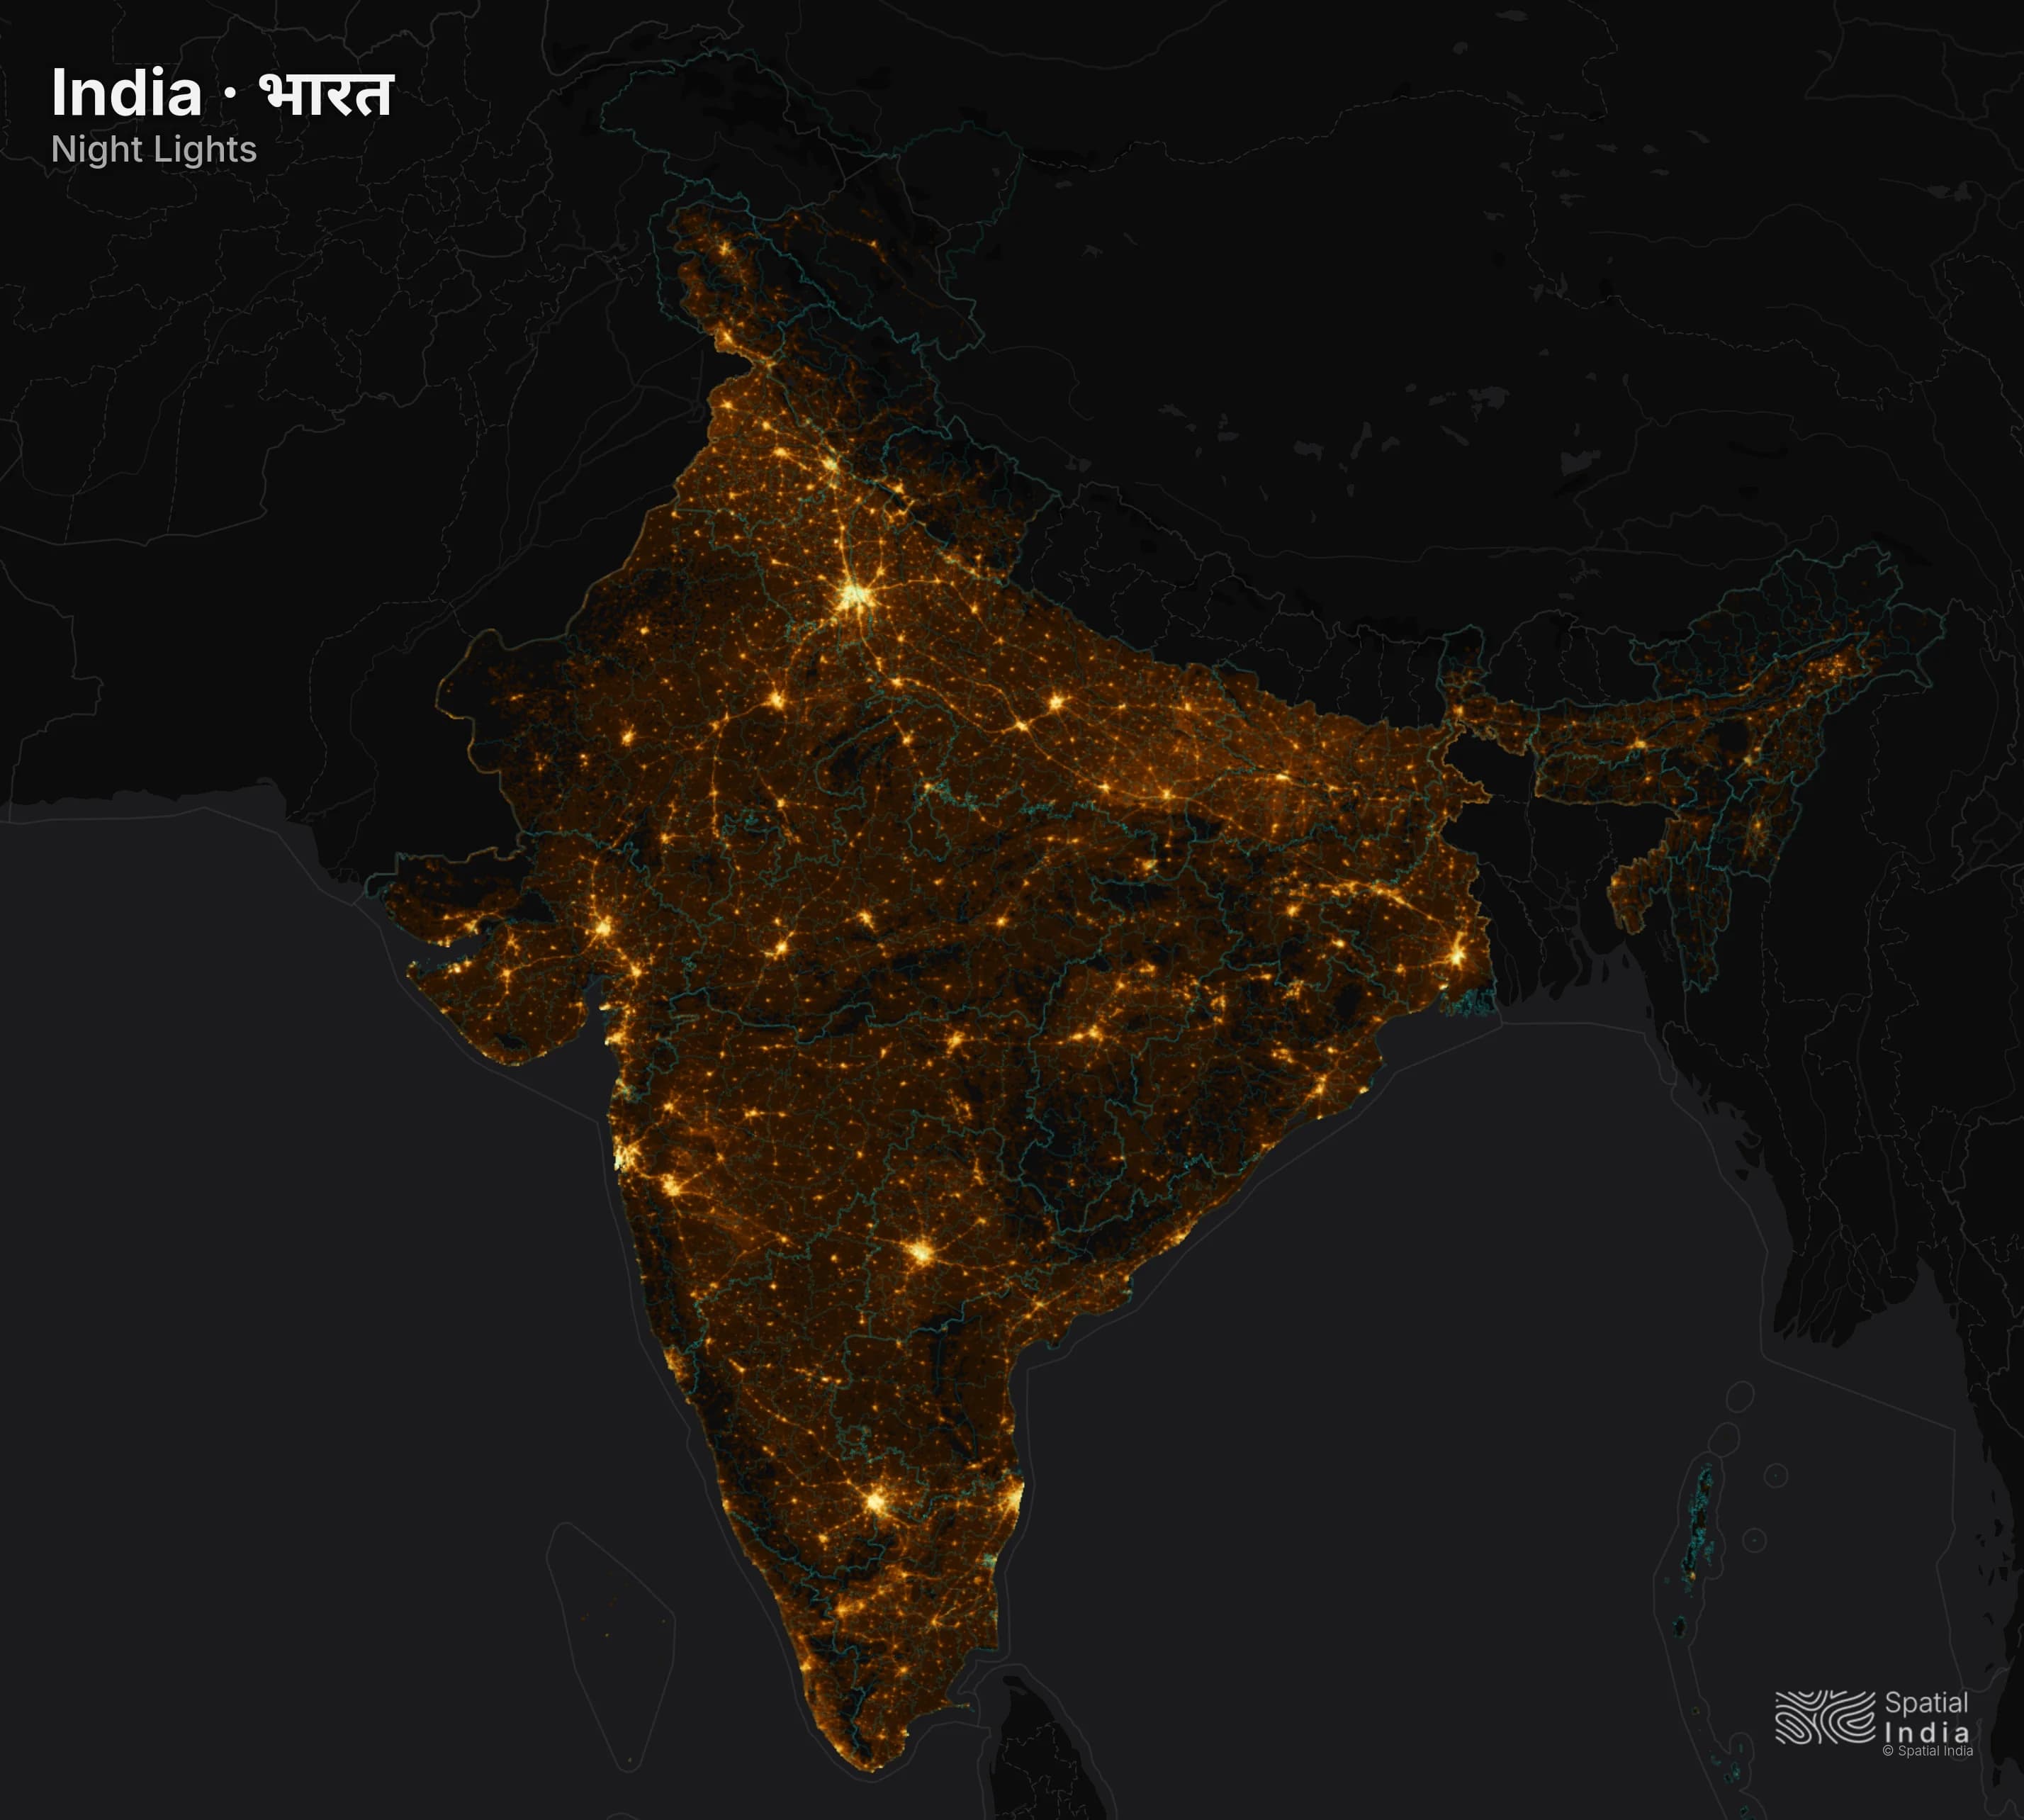
Night-time Lights as Economic Proxy
Overlay NASA VIIRS satellite imagery (2015–2024) to visualise economic activity where traditional GDP data doesn't exist at district level. Ten years of annual data — track which districts are brightening and which are dimming.
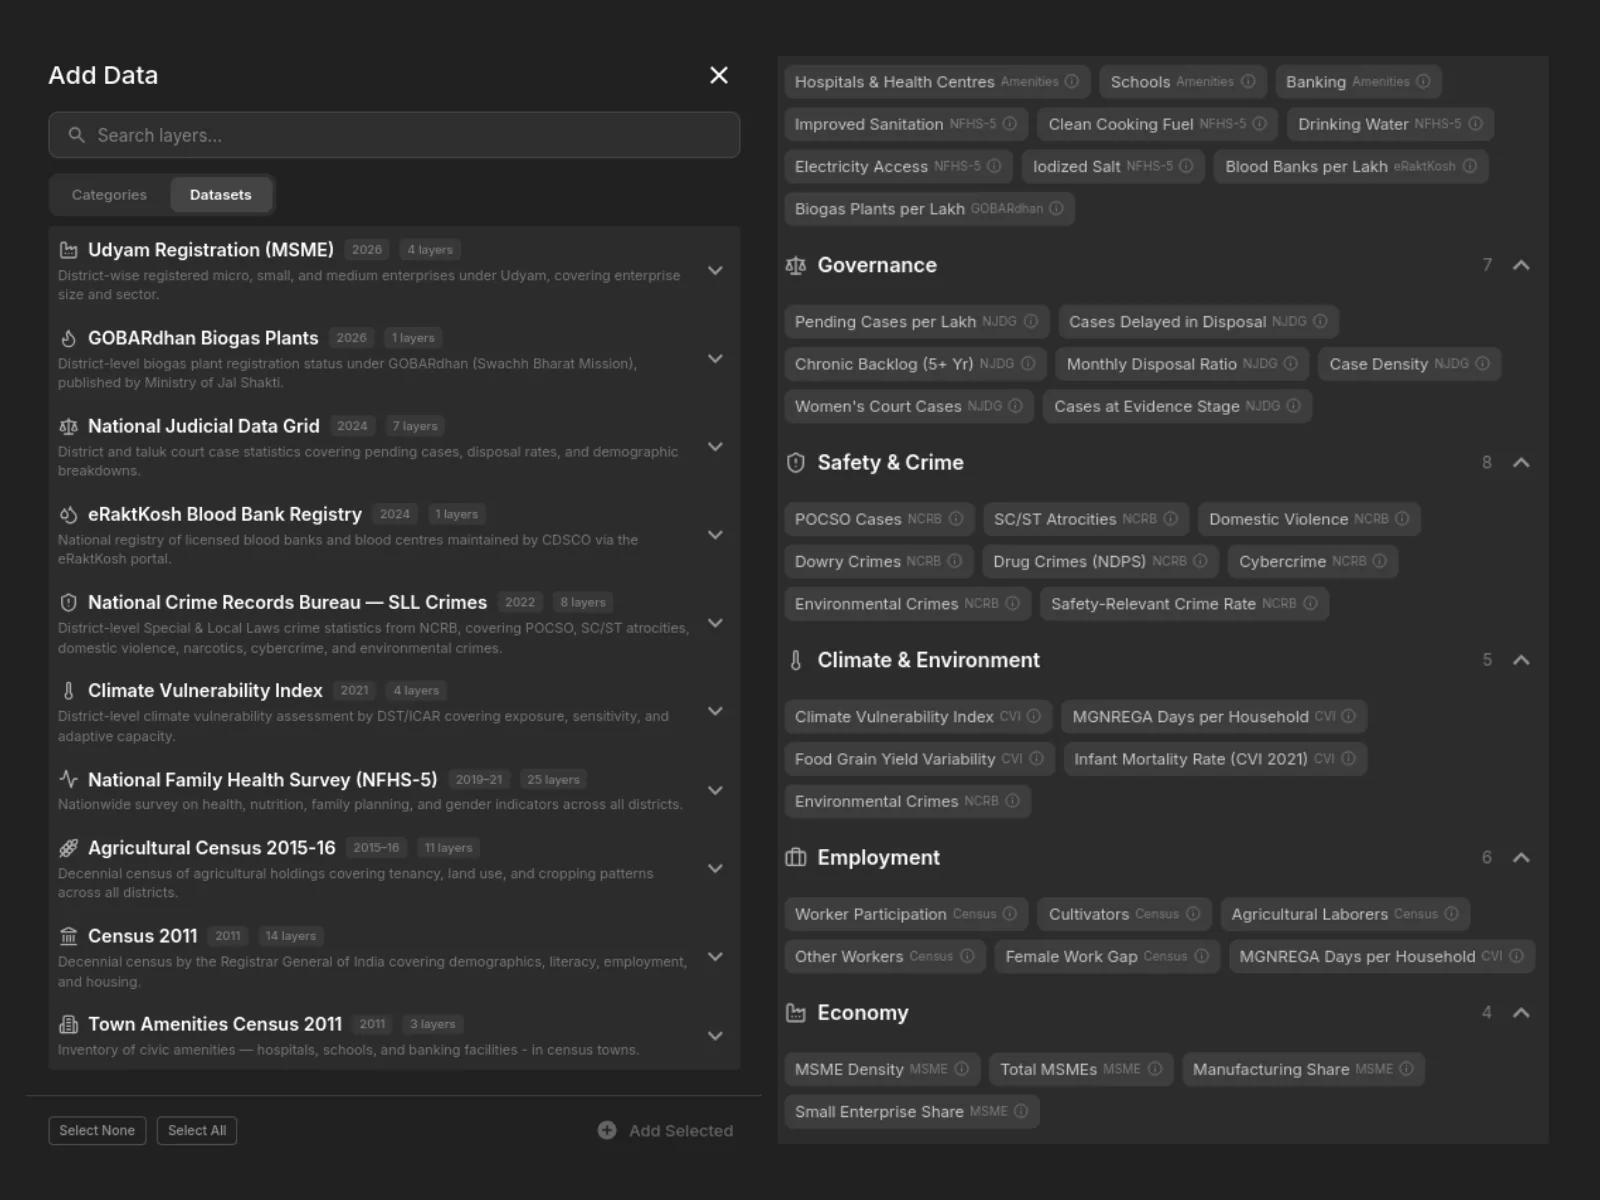
Multi-Source Integration
Census, NFHS-5, NJDG judicial data, climate vulnerability, agricultural census, MSME registrations, and crime statistics — all mapped to the same 800+ districts. Cross-sectoral analysis without cross-ministry data requests.
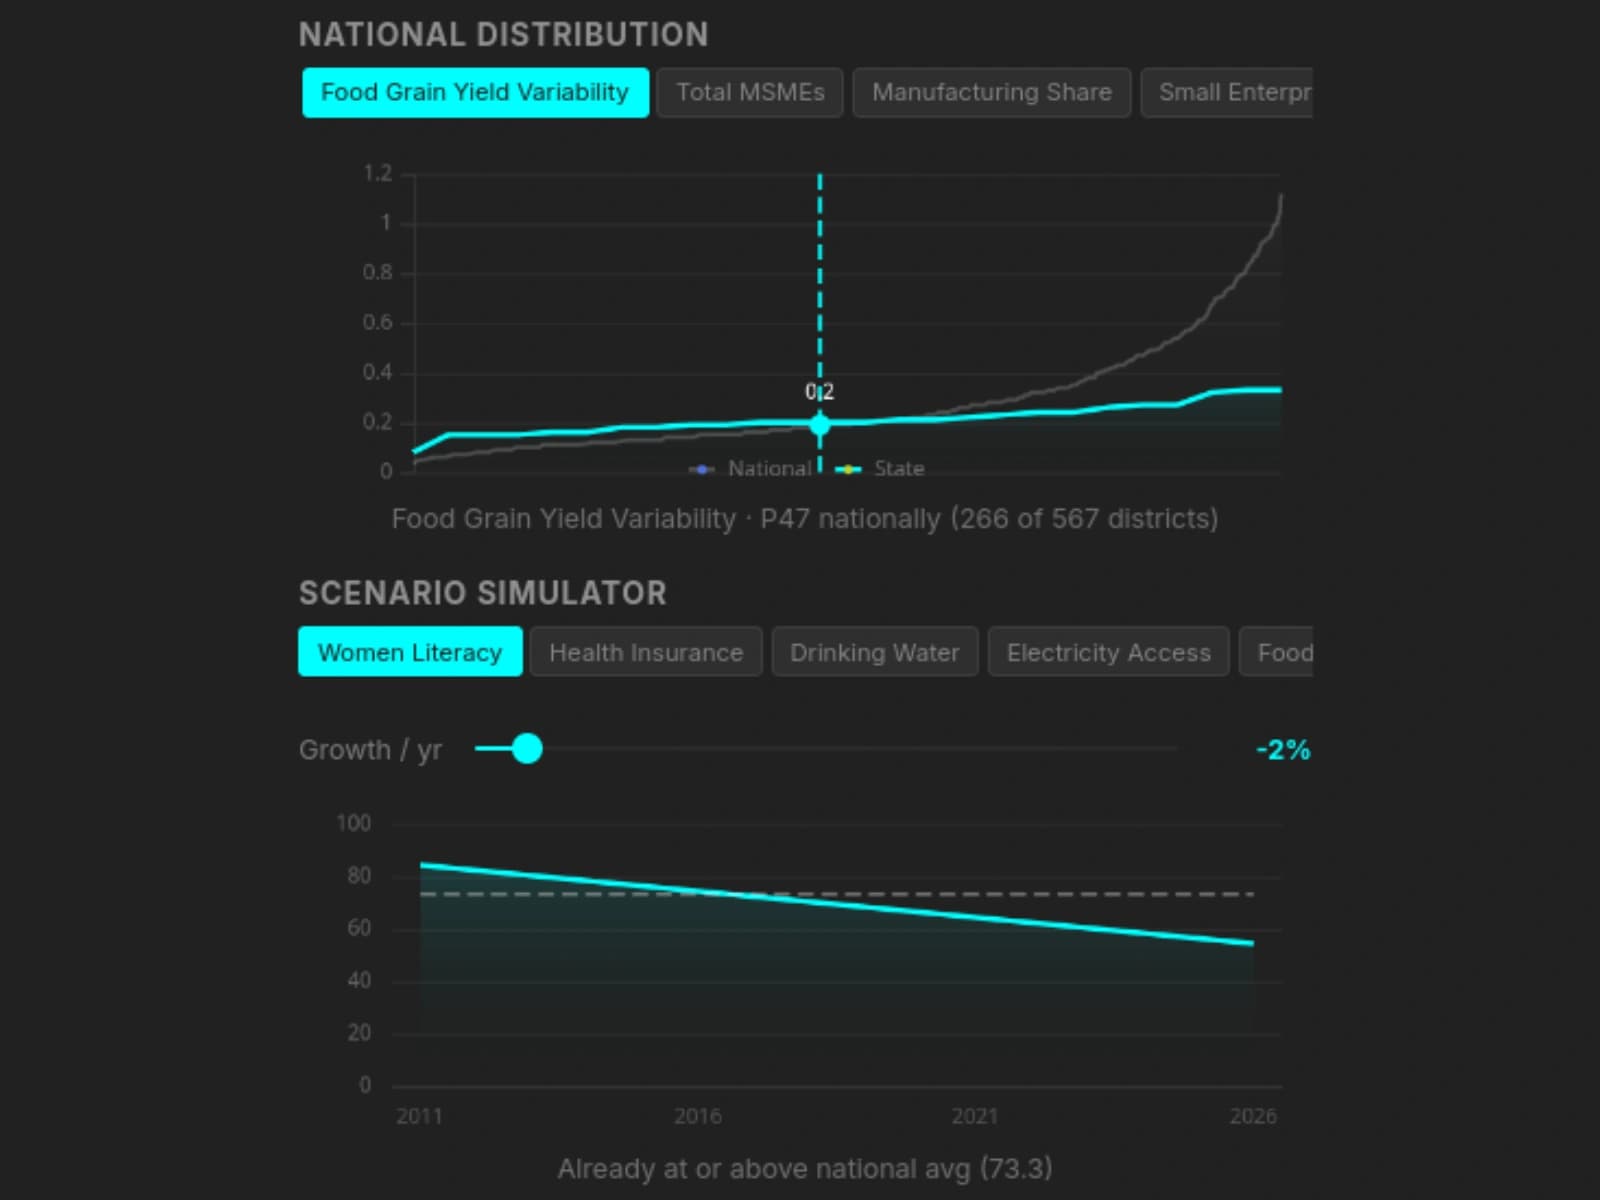
Scenario Simulator
Model how a district-level indicator evolves under different annual growth assumptions. Adjust the growth rate and see projected trajectories against state and national baselines — useful for setting scheme targets and evaluating whether current progress will close inter-district gaps within plan periods.
COVERING EVERY DEVELOPMENT DIMENSION
FOR EVIDENCE-BASED PLANNING
Identify priority districts for scheme targeting
Rank districts by deprivation on any indicator — or combine indicators to find districts that are underserved on multiple dimensions. Use the scatter plot to find districts where high investment hasn't translated into outcomes.
Prepare data-backed review presentations
Export choropleth maps with legends and source attribution. Pin focus districts and generate comparison charts. Every visual includes the data source, making it audit-ready for planning commission presentations.
Benchmark aspirational districts
Track how aspirational districts compare to their state and national peers. Use the district profile to see percentile rankings and the national distribution curve. Identify which districts are converging toward averages and which are falling behind.
BEYOND EXISTING GOVERNMENT PLATFORMS
| Feature | Government Map Portals | Central SDG Dashboards | Legacy Census-GIS | |
|---|---|---|---|---|
| District-level development data | 85+ indicators from 10+ sources | (infrastructure only) | (state-level only) | (basic, outdated UI) |
| Cross-sectoral analysis | Health, education, economy in one view | (pre-defined indicators) | ||
| Interactive data exploration | Scatter plots, correlation, filtering | |||
| Side-by-side district benchmarking | Pin up to 10 districts, compare instantly | |||
| Night-time lights economic proxy | NASA VIIRS 2015–2024, annual | |||
| State drill-down with benchmarks | Click any state, see all districts | (state-level only) | (limited) | |
| Presentation-ready map exports | PNG with legend & source attribution | |||
| District ranking & prioritization | Sort 800+ districts by any metric | |||
| Census 2027 ready | Architecture ready, day-one support |
Spatial India vs Government Map Portals
Spatial India vs Central SDG Dashboards
Spatial India vs Legacy Census-GIS
The data your districts generate — made visible
Free web access — no procurement required. No software installation, no GIS training required. Built for Indian governance workflows, with Census 2027 integration in progress.