District Rainfall (India Meteorological Department)
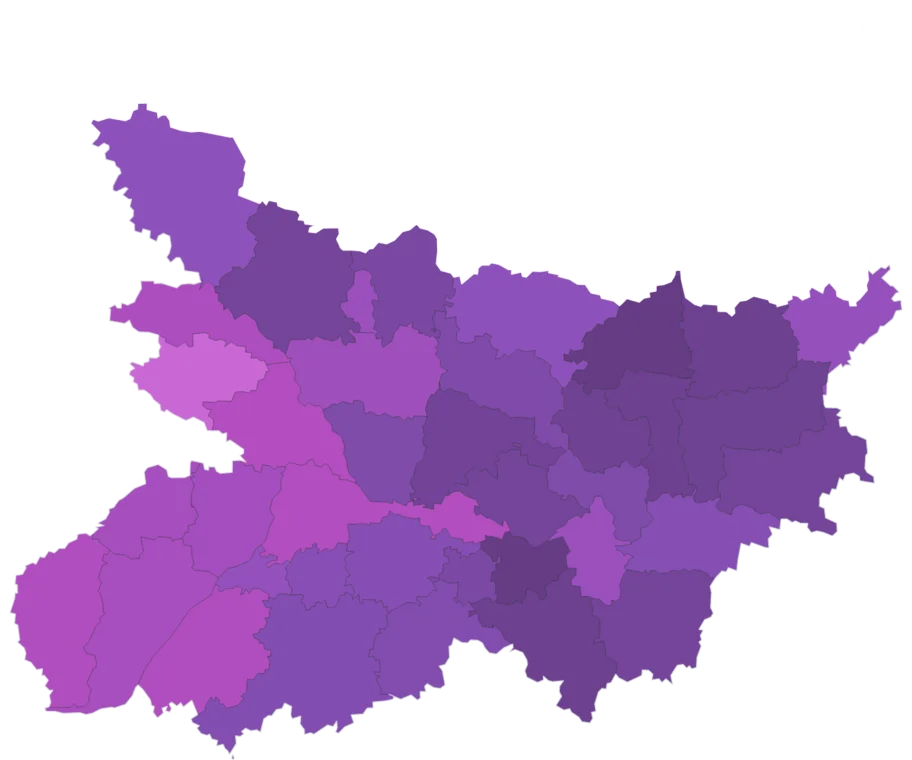
Rainfall in each district against its normal, by season, 2021 to 2026: the June–September monsoon every year and the full calendar year 2025. India Meteorological Department district rainfall, via NITI Aayog NDAP.
Published 2021–2026 · 6 indicators · mapped to 808 districts · platform version 2026-11-11
New districts: inherited from parent district
Districts created after this source was published have no measurement of their own. For this source those values are inherited from parent district and flagged in the interface, so you can filter them out. See the methodology for why this method applies here and where it is weakest.
Indicators
Climate & Environment
Monsoon Rainfall vs Normal
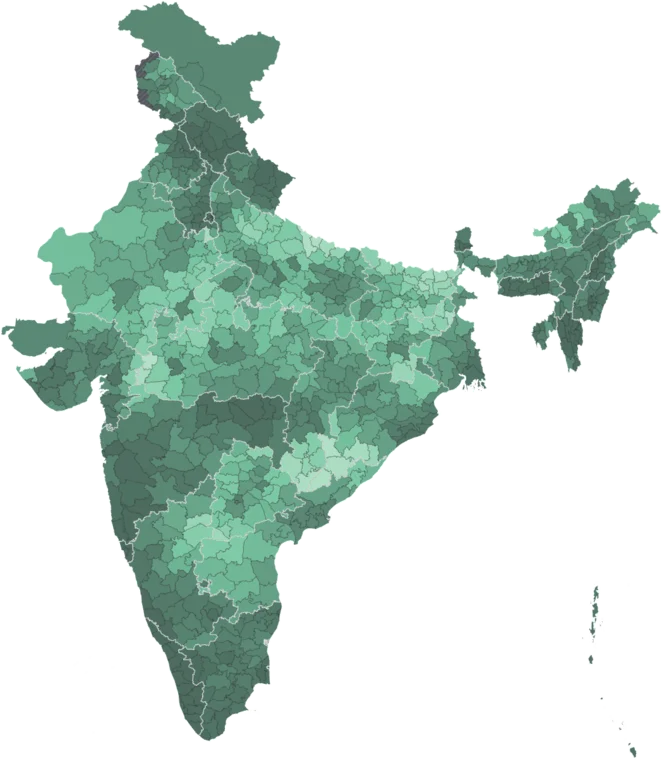
Map itHow much more or less rain fell in June–September 2026 than the district's normal — its long-term average for the same days. IMD calls −20% or lower deficient, −60% or lower large deficient, and +20% or higher excess.
Caveat: IMD real-time data, not final. Normal is the 1971–2020 average (1961–2010 for 2021). Source gaps and broken rows are left blank; new districts show their parent district's value.
Monsoon Rainfall
Map itRain that fell from June to September 2026, in millimetres, beside the district's normal — its long-term average for the same days.
Caveat: IMD real-time data, not final. Normal is the 1971–2020 average (1961–2010 for 2021). Source gaps and broken rows are left blank; new districts show their parent district's value.
Annual Rainfall vs Normal
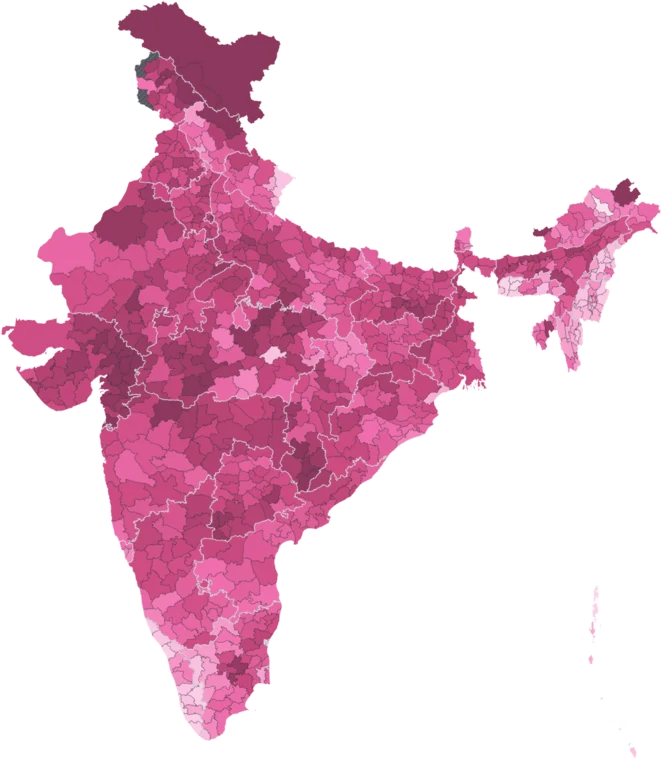
Map itHow much more or less rain fell in all of 2025 than the district's normal yearly total. Includes the October–December monsoon, the main rains in Tamil Nadu and coastal Andhra Pradesh.
Caveat: Sum of IMD's four seasons; blank if any season is missing. IMD real-time data, not final. Normal is the 1971–2020 average (1961–2010 for 2021). Source gaps and broken rows are left blank; new districts show their parent district's value.
Deficient Monsoons
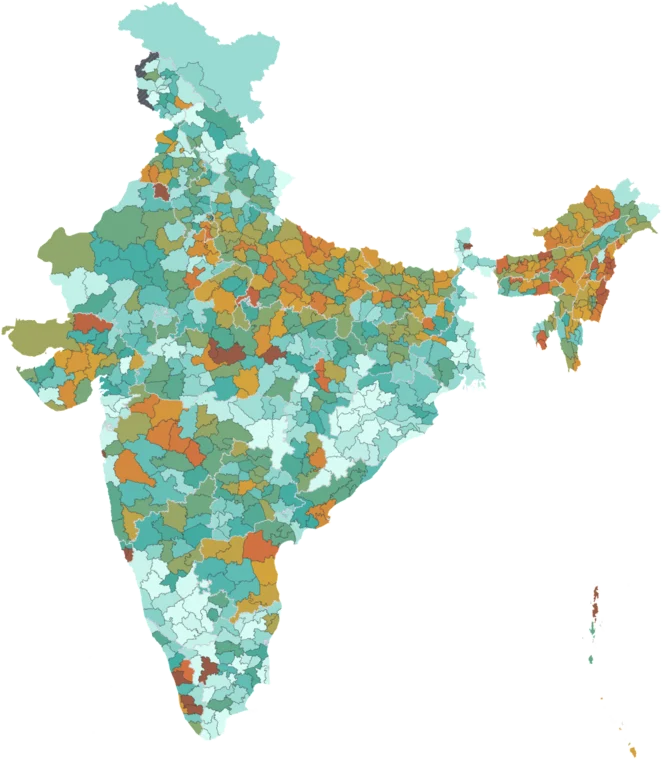
Map itIn how many of the six monsoons from 2021 to 2026 the district got at least 20% less rain than normal — IMD's "deficient" level.
Caveat: Blank unless all six years have data. IMD real-time data, not final. Normal is the 1971–2020 average (1961–2010 for 2021). Source gaps and broken rows are left blank; new districts show their parent district's value.
Excess Monsoons
Map itIn how many of the six monsoons from 2021 to 2026 the district got at least 20% more rain than normal — IMD's "excess" level.
Caveat: Season totals, so one extreme-rain day does not count by itself. Blank unless all six years have data. IMD real-time data, not final. Normal is the 1971–2020 average (1961–2010 for 2021). Source gaps and broken rows are left blank; new districts show their parent district's value.
Average Monsoon vs Normal
Map itThe district's average gap from normal across the six monsoons, 2021–2026. Shows places that stay dry or wet year after year, not one bad season.
Caveat: Bageshwar and Tirunelveli read high every year, likely a normal set too low. Blank unless all six years have data. IMD real-time data, not final. Normal is the 1971–2020 average (1961–2010 for 2021). Source gaps and broken rows are left blank; new districts show their parent district's value.
Where this data is highest and lowest
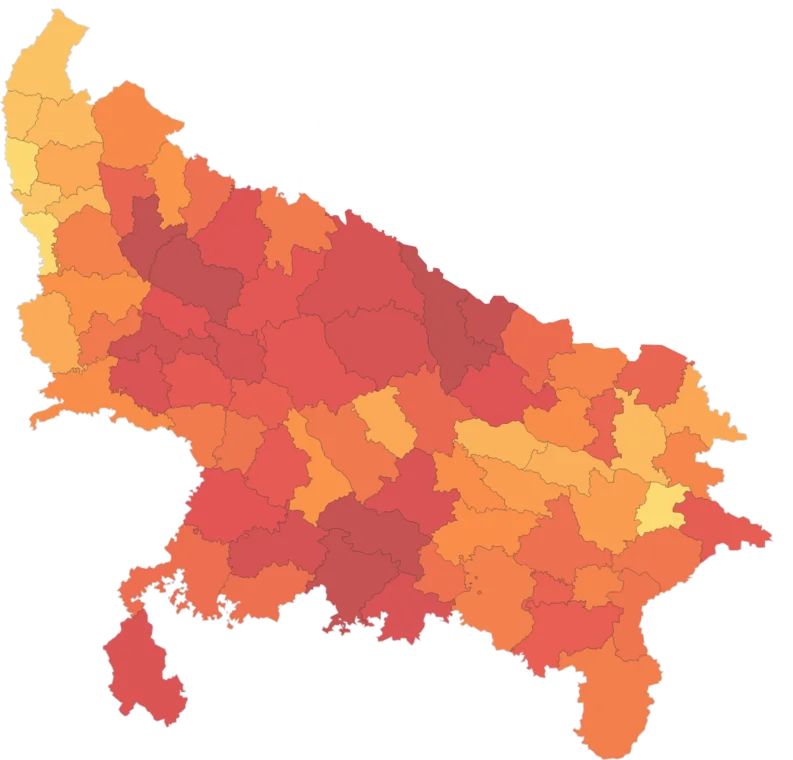
Across all 808 districts, by monsoon rainfall vs normal. Every district has its own page.
Using this data
Free to explore and export. Cite the original publisher for published figures and cite us as well where your result depends on the crosswalk. Per-layer limitations are listed on the caveats page.
The publisher requires this credit wherever their figures appear. Reproduce it as written: