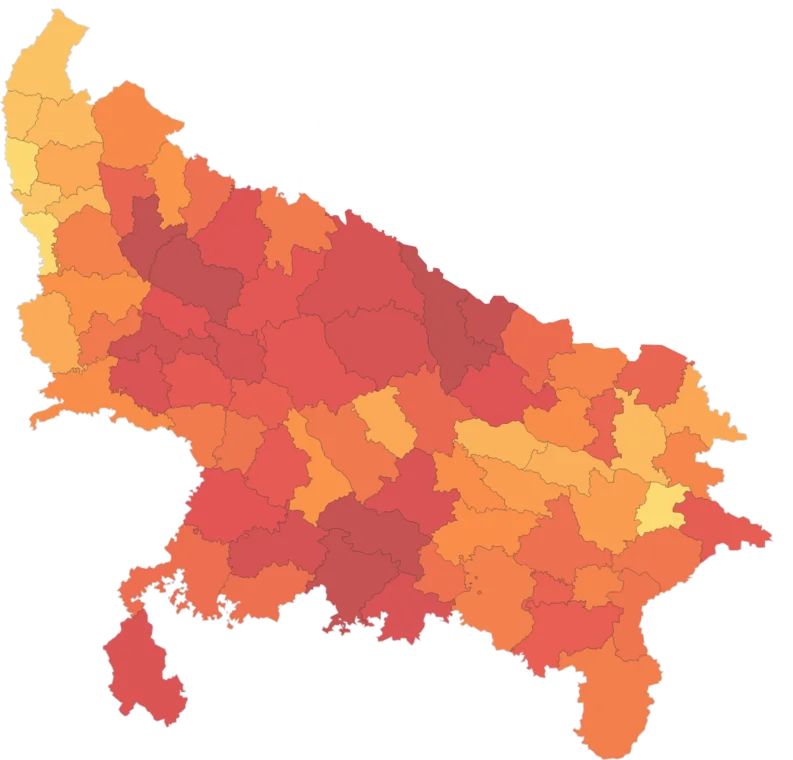
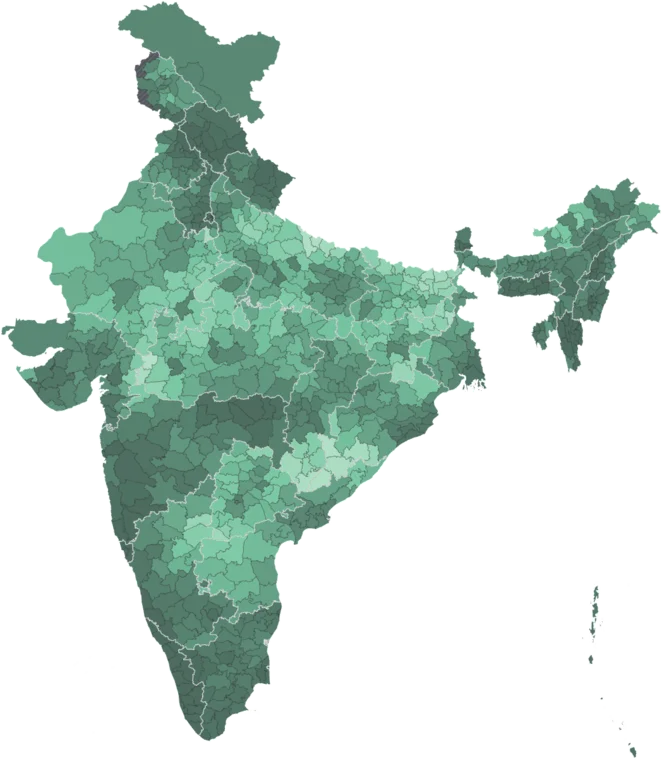
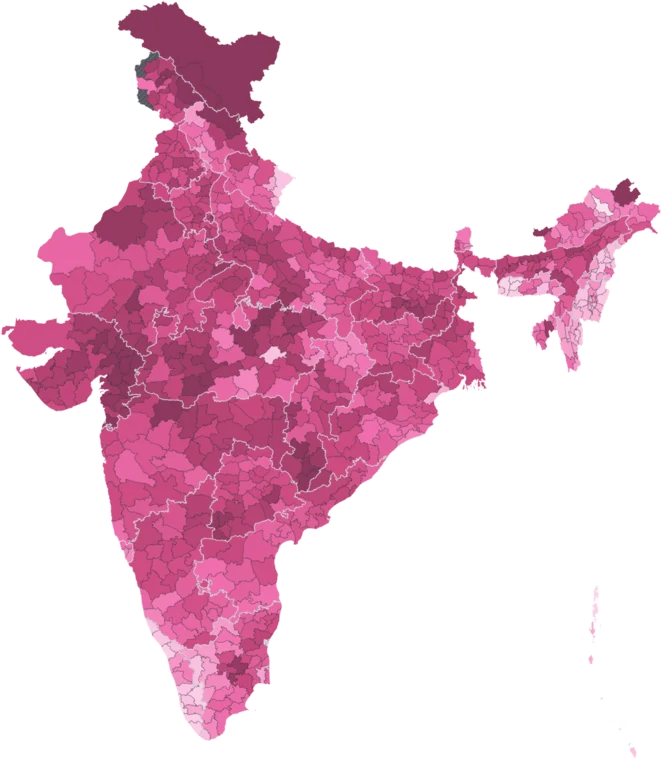
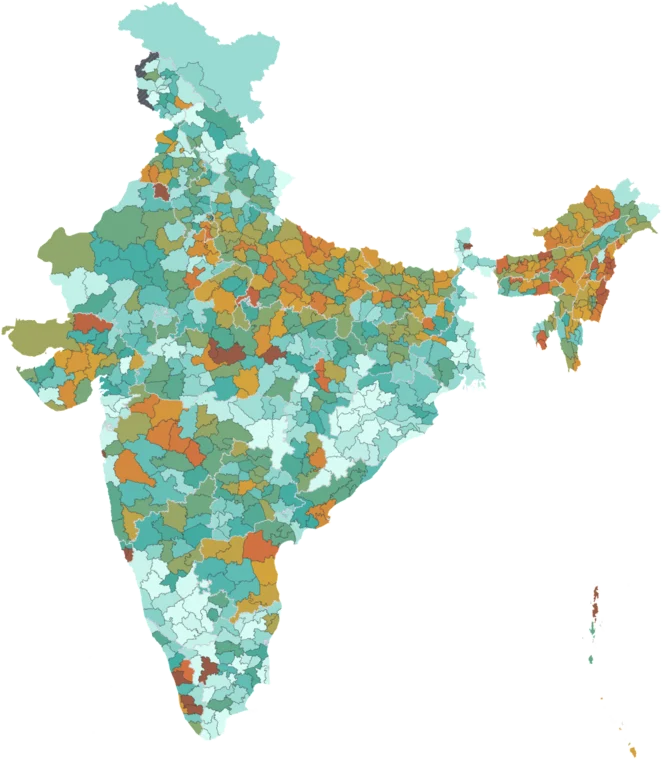
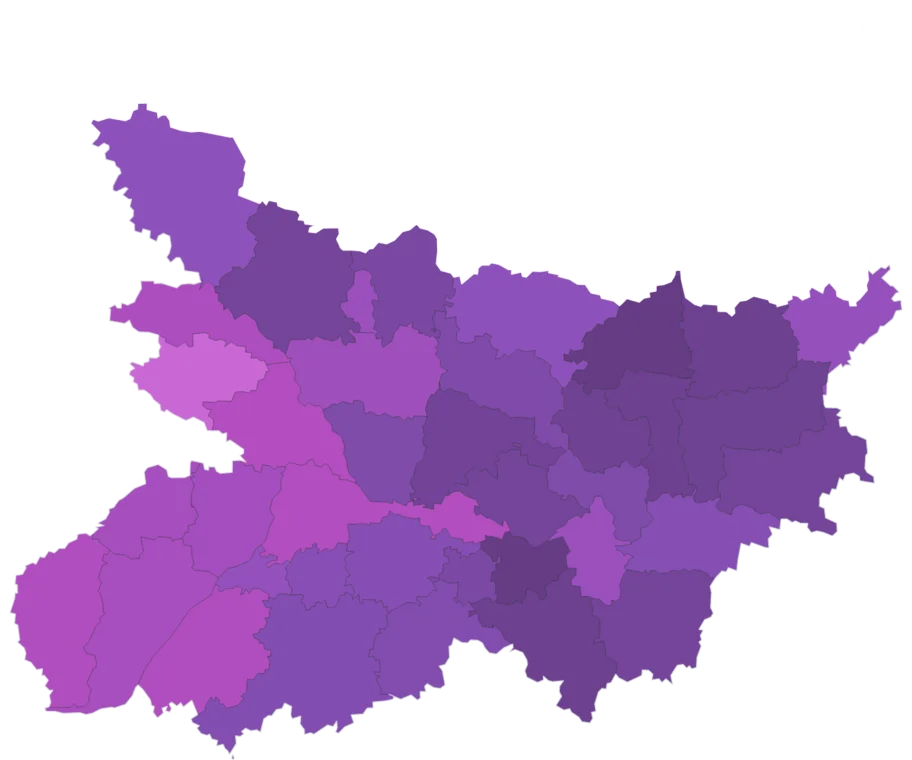
MGNREGA Days per Household by district
Average days of employment provided per household under MGNREGA in a year. Higher values indicate greater rural distress and demand for wage labor.
- National
- 43.4 days
- a plain mean of districts
- Highest district
- 98.6 days
- South Tripura, Tripura
- Lowest district
- 0 days
- Ranga Reddy, Telangana
- Districts measured
- 618
- 68 more estimated
The middle 80% of measured districts lie between 22.9 and 60.5 days. 339 of 618 measured districts sit above the national figure of 43.4 days. 6 of the 10 highest districts are in Tripura. Among 26 states and union territories, Tripura is highest at 87.5 days and Telangana lowest at 0.6 days.
How districts spread
Each bar is a band of values; its height is the number of districts in it, 618 in all. Colours match the map.
By state
26 states and union territories, a plain mean of districts. The line marks the national figure, 43.4 days.
Read with care
Caveat
Reflects both rural distress and state implementation capacity.
68 districts estimated
Districts formed after the source was published have no reading of their own. Their values are inherited from parent district and are left out of the rankings and the distribution. See the methodology.
Citing this data
Cite the original publisher for published figures and cite us as well where your result depends on the district crosswalk. More limits on the caveats page.