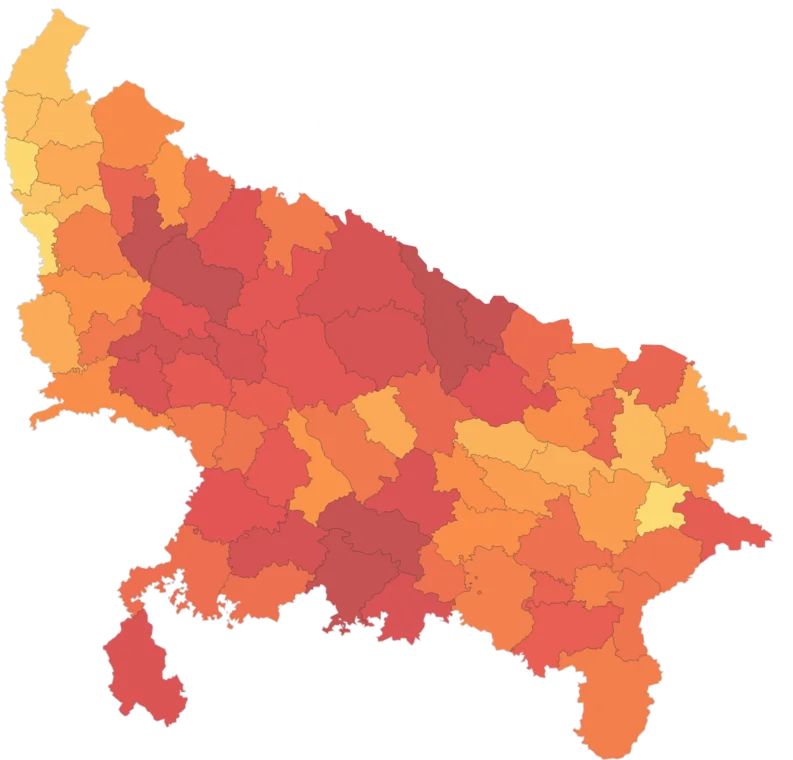
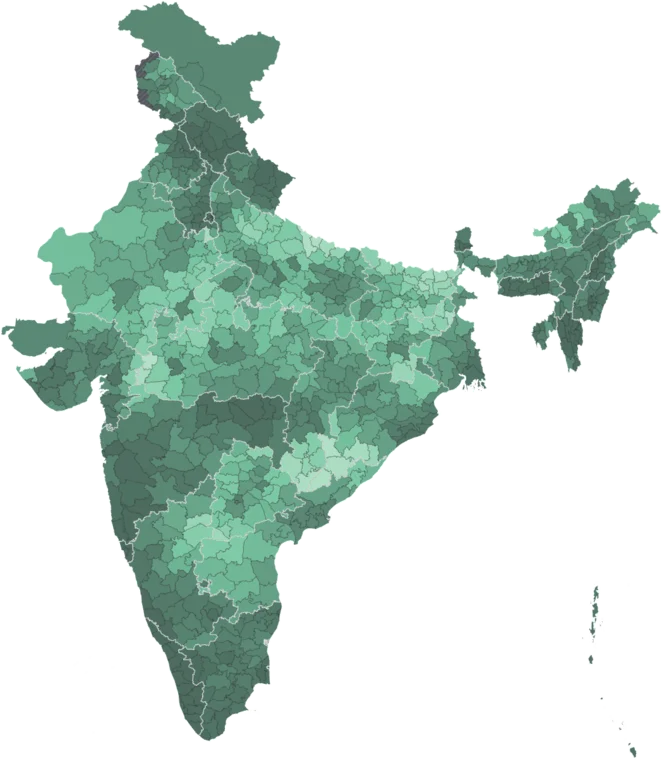
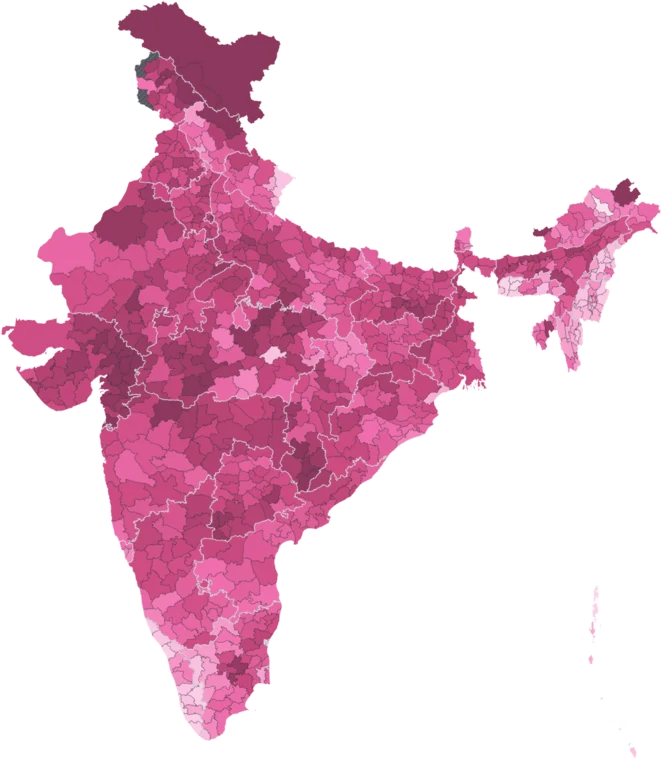
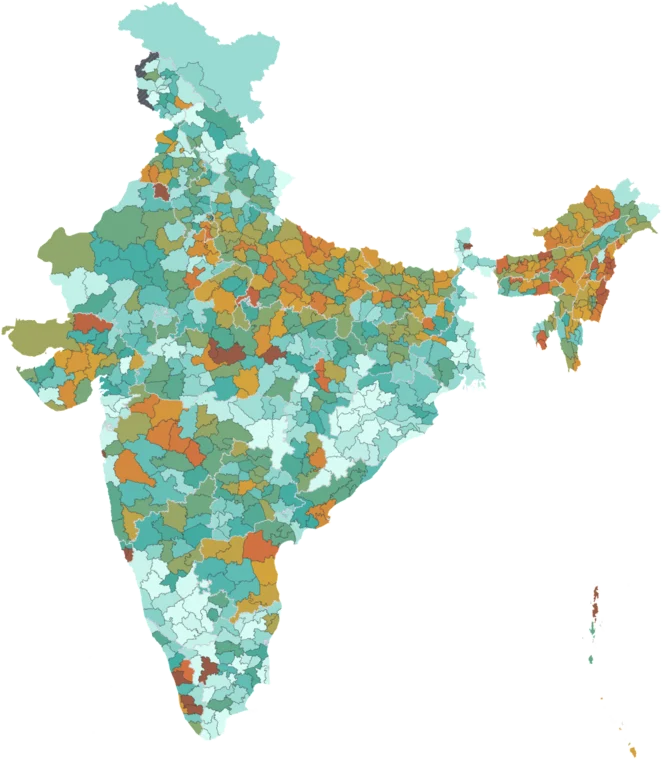
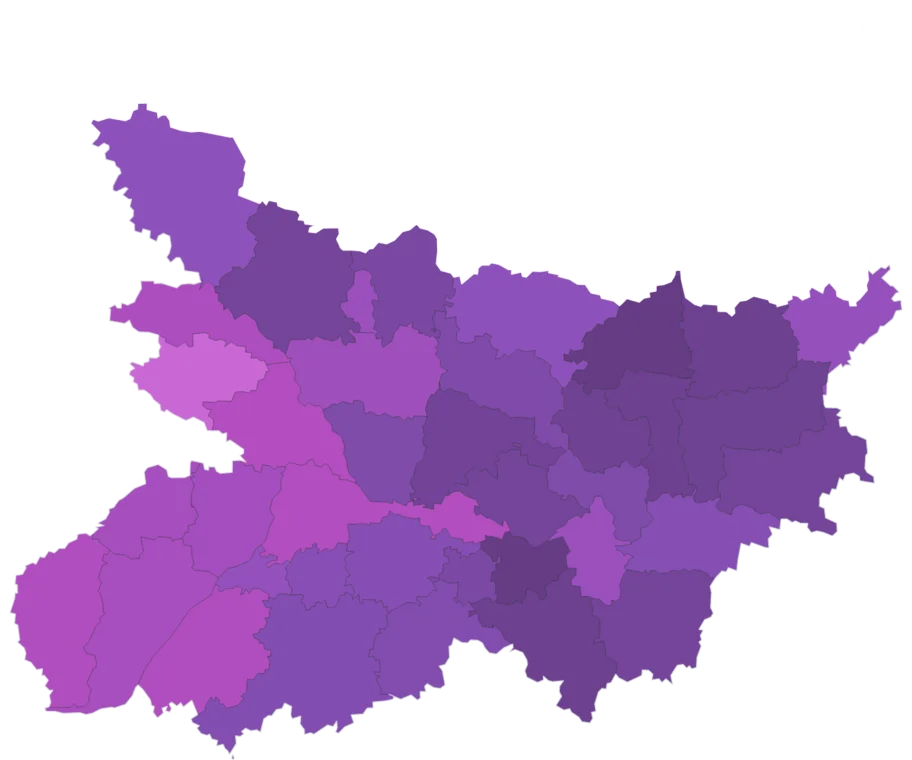
Literacy Rate by district
Literates as a share of the population aged 7 and over.
- National
- 72.7%
- population-weighted across districts
- Highest district
- 98.0%
- Serchhip, Mizoram
- Lowest district
- 34.8%
- Sukma, Chhattisgarh
- Districts measured
- 742
- 35 more estimated
The middle 80% of measured districts lie between 58.0% and 85.2%. 348 of 742 measured districts sit above the national figure of 72.7%. 5 of the 10 highest districts are in Mizoram. Among 36 states and union territories, Kerala is highest at 94.0% and Bihar lowest at 61.7%.
How districts spread
Each bar is a band of values; its height is the number of districts in it, 742 in all. Colours match the map.
By state
36 states and union territories, population-weighted across districts. The line marks the national figure, 72.7%.
Read with care
Caveat
Denominator is population aged 7+, the Census of India definition. Children under 7 are excluded — dividing by total population instead reads about 10 points low.
35 districts estimated
Districts formed after the source was published have no reading of their own. Their values are area-proportional estimate and are left out of the rankings and the distribution. See the methodology.
Citing this data
Cite the original publisher for published figures and cite us as well where your result depends on the district crosswalk. More limits on the caveats page.