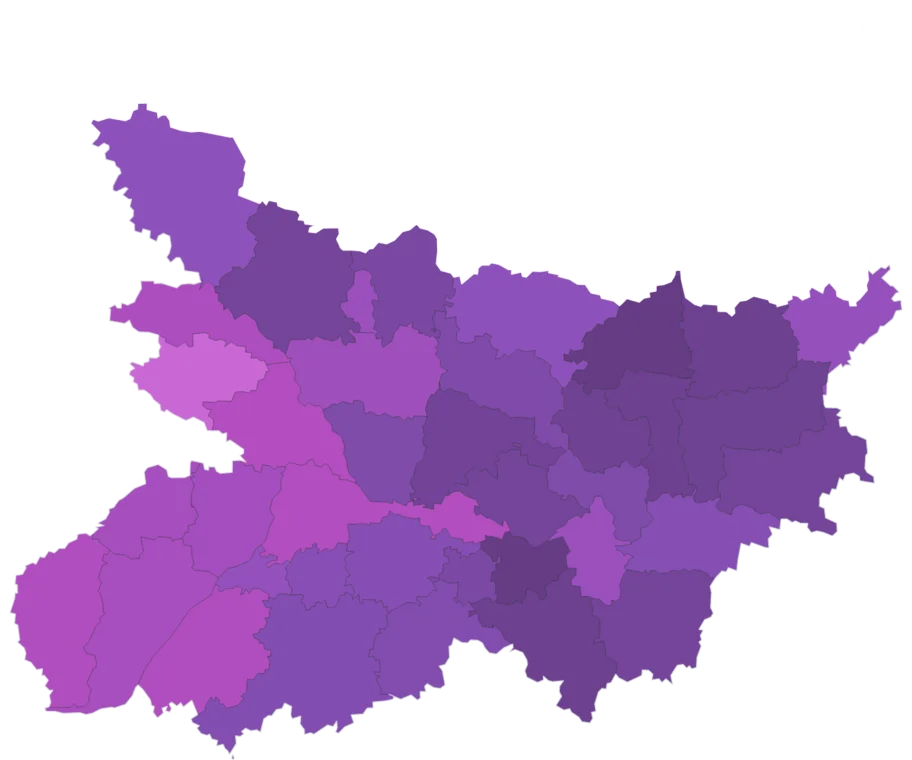
Pupil-Teacher Ratio by district
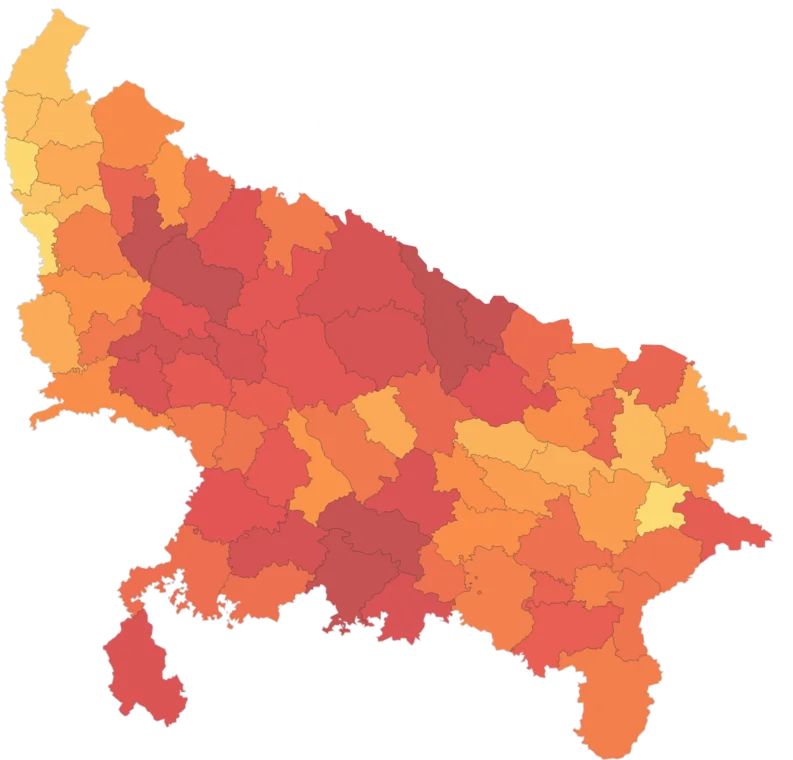
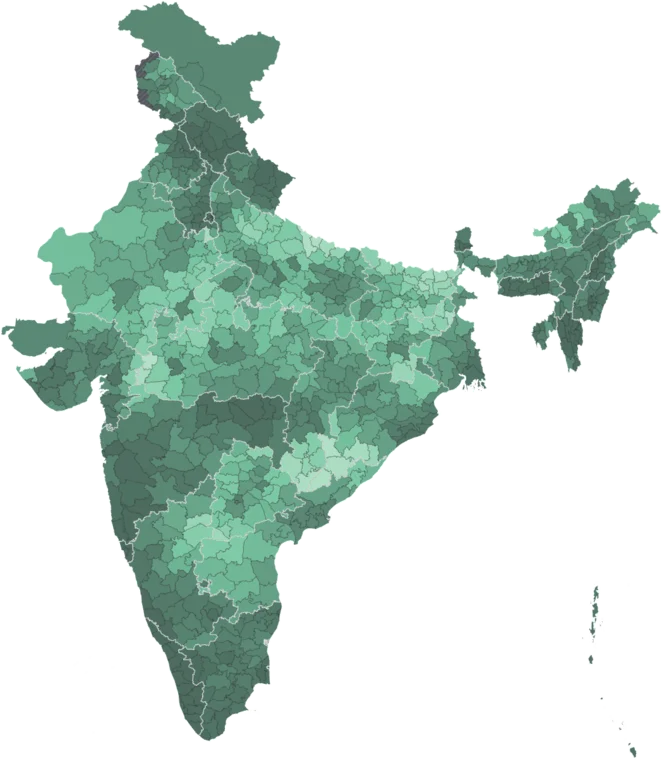
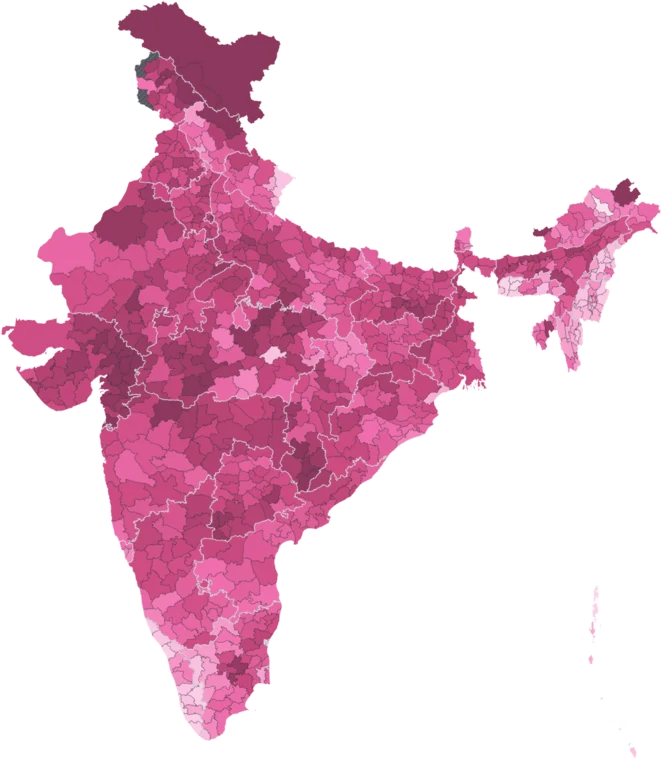
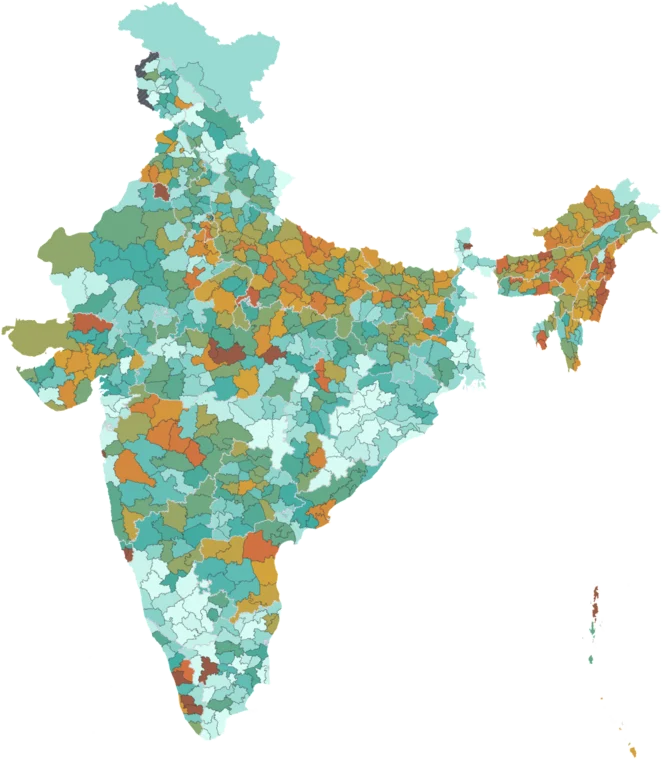
Students enrolled per teacher, pre-primary to class 12, all schools, 2024-25.
- National
- 24.4 per teacher
- a plain mean of districts
- Highest district
- 54.7 per teacher
- Sahibganj, Jharkhand
- Lowest district
- 4.1 per teacher
- Lahul & Spiti, Himachal Pradesh
- Districts measured
- 768
- 9 more estimated
The middle 80% of measured districts lie between 14.1 and 30.2 per teacher. 279 of 768 measured districts sit above the national figure of 24.4 per teacher. 8 of the 10 highest districts are in Jharkhand. Among 36 states and union territories, Jharkhand is highest at 35.5 per teacher and Sikkim lowest at 7.8 per teacher.
How districts spread
Each bar is a band of values; its height is the number of districts in it, 768 in all. Colours match the map.
By state
36 states and union territories, a plain mean of districts. The line marks the national figure, 24.4 per teacher.
Read with care
Caveat
All enrolment over all teachers, so it blends levels and hides crowded single schools. Small hill districts read low because many small schools each need a teacher. UDISE+ 2024-25, filed by every school each year; not a survey. From 2024-25 students are counted one by one, so earlier years do not compare. Delhi, Karnataka, Puducherry, Darjeeling and Papum Pare combine several education districts. New districts with no row show their parent's value.
9 districts estimated
Districts formed after the source was published have no reading of their own. Their values are inherited from parent district and are left out of the rankings and the distribution. See the methodology.
Citing this data
Cite the original publisher for published figures and cite us as well where your result depends on the district crosswalk. More limits on the caveats page.