Census 2011
Decennial census by the Registrar General of India covering demographics, literacy, employment, and housing.
Published 2011 · 15 indicators · mapped to 808 districts · platform version 2026-09-20
New districts: area-proportional estimate
Districts created after this source was published have no measurement of their own. For this source those values are area-proportional estimate and flagged in the interface, so you can filter them out. See the methodology for why this method applies here and where it is weakest.
Indicators
Demographics
Population
Map itPopulation data from the 2011 Census of India.
Caveat: New districts use area-proportional estimates.
Households
Map itHousehold data from the 2011 Census of India.
Caveat: New districts use area-proportional estimates.
Children
Map itChildren (0-6 years) data from the 2011 Census of India.
Caveat: New districts use area-proportional estimates.
Scheduled Castes
Map itScheduled Caste population as a share of total district population, from the 2011 Census of India.
Caveat: SC lists vary by state — not all communities recognized nationwide.
Scheduled Tribes
Map itScheduled Tribe population as a share of total district population, from the 2011 Census of India.
Caveat: ST lists vary by state — not all communities recognized nationwide.
Sex Ratio
Map itFemales per 1,000 males. National average is ~940. Below 900 indicates severe gender imbalance.
Caveat: National average ~940; below 900 signals severe imbalance.
Child Sex Ratio (0–6)
Map itGirls per 1,000 boys aged 0–6. Below 900 signals sex-selective practices. National average is ~914.
Caveat: Below 900 may indicate sex-selective practices.
Education
Literacy Rate
Map itLiterates as a share of the population aged 7 and over, from the 2011 Census of India.
Caveat: Denominator is population aged 7+, the Census of India definition. Children under 7 are excluded — dividing by total population instead reads about 10 points low.
Literate Population
Map itNumber of literate people from the 2011 Census of India. For the rate, use Literacy Rate.
Caveat: A headcount, not a rate — it tracks district size. Counts ages 7+ only.
Female Literacy Gap
Map itDifference between male and female literacy rates. Higher values mean women are significantly less literate than men.
Caveat: Gap = male literacy rate minus female literacy rate.
Women & Gender
Female Literacy Gap
Map itDifference between male and female literacy rates. Higher values mean women are significantly less literate than men.
Caveat: Gap = male literacy rate minus female literacy rate.
Female Work Gap
Map itDifference between male and female worker participation rates. High values indicate women are largely excluded from the workforce.
Caveat: Includes main and marginal workers.
Employment
Worker Participation
Map itShare of total population engaged in any work (main or marginal), from the 2011 Census of India.
Caveat: Includes main and marginal workers.
Cultivators
Map itMain cultivators (farmers who own or work land) as a share of total population, from the 2011 Census of India.
Caveat: Includes both owner-farmers and tenant farmers.
Agricultural Laborers
Map itMain agricultural laborers (landless farm workers) as a share of total population, from the 2011 Census of India.
Caveat: Landless wage workers on others' farms.
Other Workers
Map itMain workers in non-agricultural occupations (industry, services, trade) as a share of total population, from the 2011 Census of India.
Caveat: Residual category — industry, services, trade, etc.
Female Work Gap
Map itDifference between male and female worker participation rates. High values indicate women are largely excluded from the workforce.
Caveat: Includes main and marginal workers.
Where this data is highest and lowest
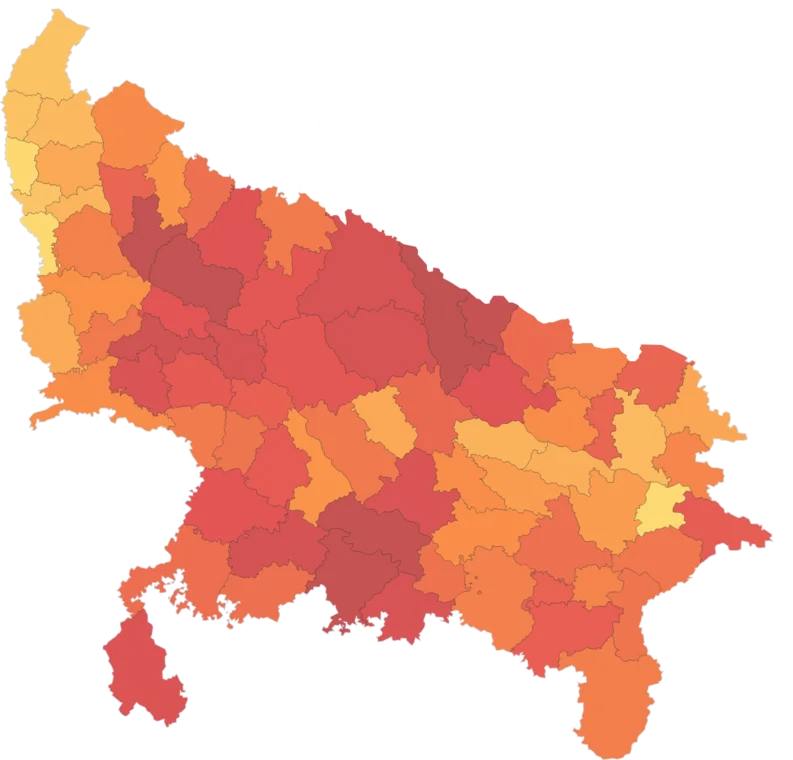
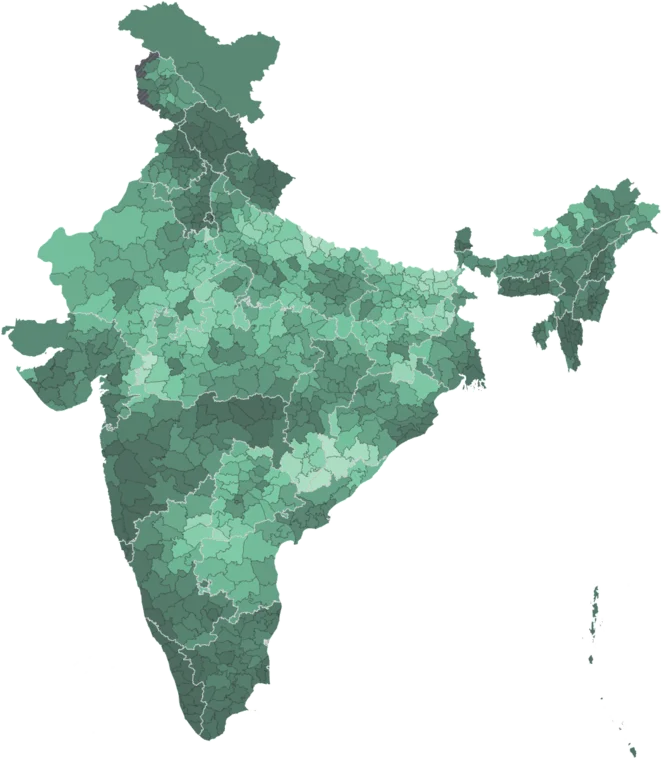
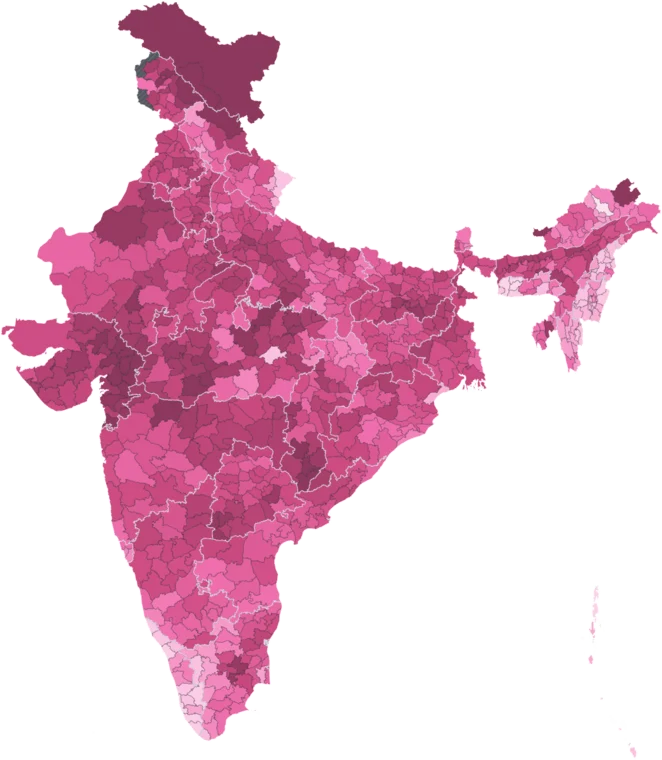
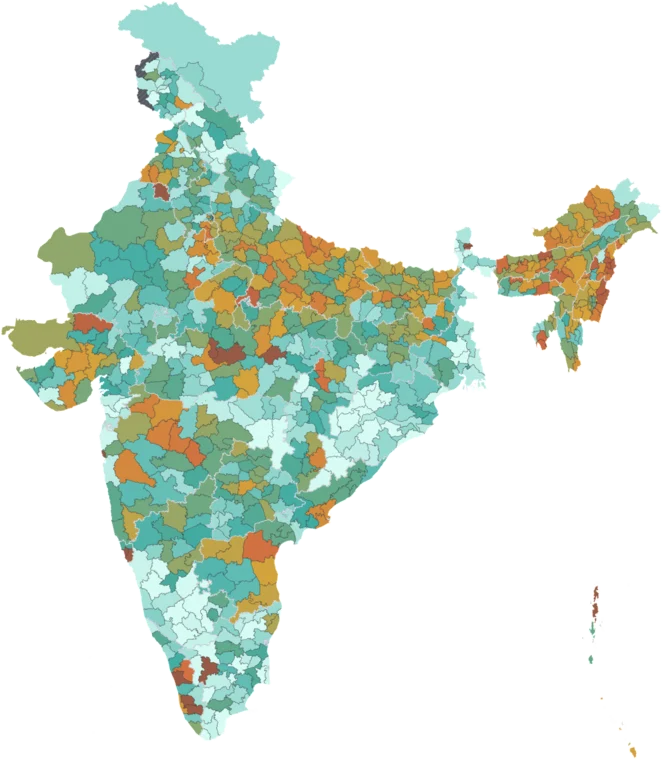
Across all 808 districts, by population. Every district has its own page.
Using this data
Free to explore and export. Cite the original publisher for published figures and cite us as well where your result depends on the crosswalk. Per-layer limitations are listed on the caveats page.
The publisher requires this credit wherever their figures appear. Reproduce it as written: