School Enrolment by Social Group (UDISE)
Enrolment in every school by class and social group, 2018-19, summed to districts: how the SC and ST share of students in classes 11–12 compares with their share in classes 1–5. Ministry of Education UDISE enrolment data, via NITI Aayog NDAP.
Published 2018–19 · 1 indicator · mapped to 808 districts · platform version 2026-11-16
New districts: inherited from parent district
Districts created after this source was published have no measurement of their own. For this source those values are inherited from parent district and flagged in the interface, so you can filter them out. See the methodology for why this method applies here and where it is weakest.
Indicators
Education
SC/ST Students Reaching Class 11–12
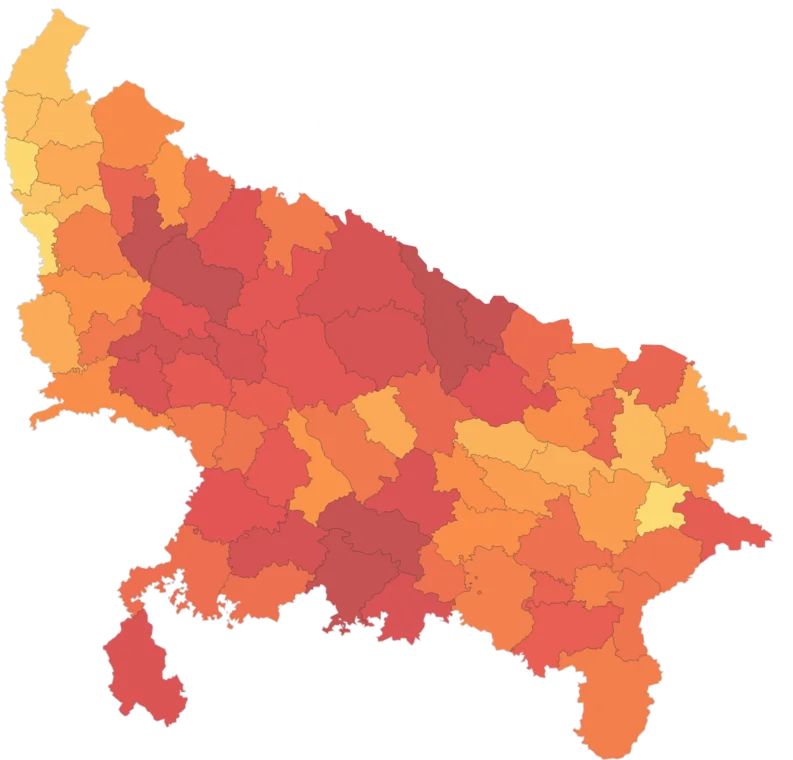
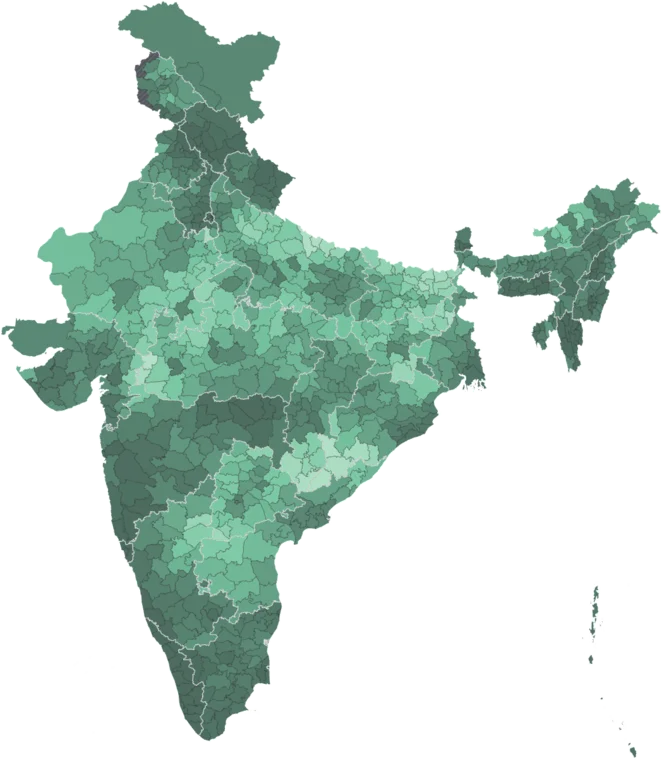
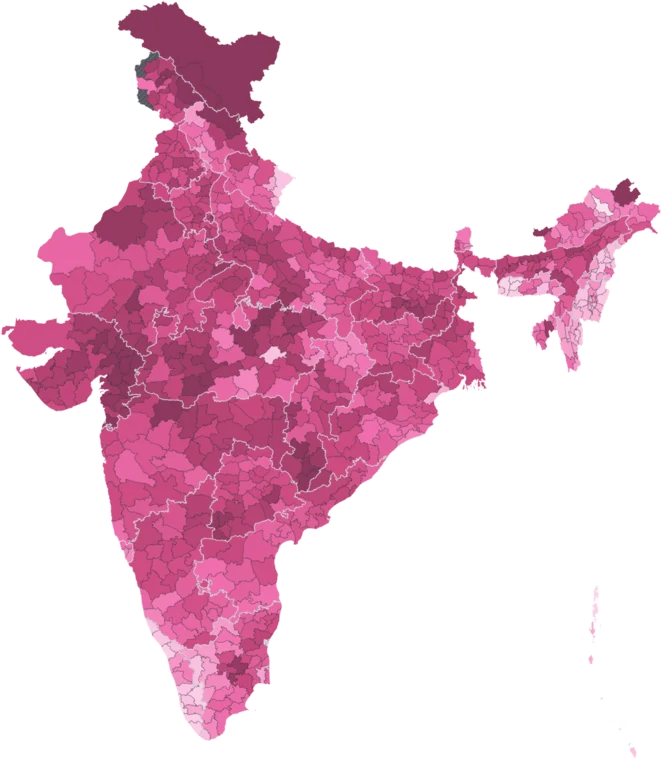
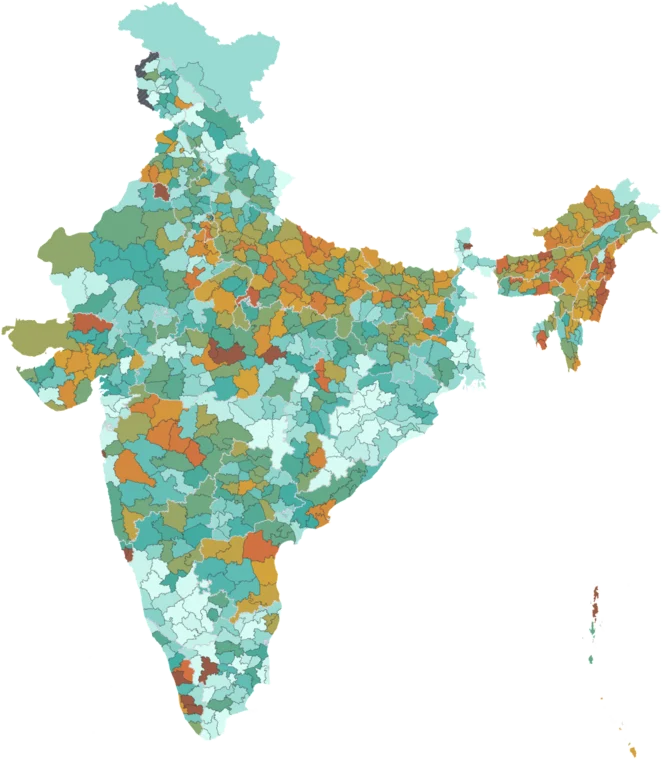
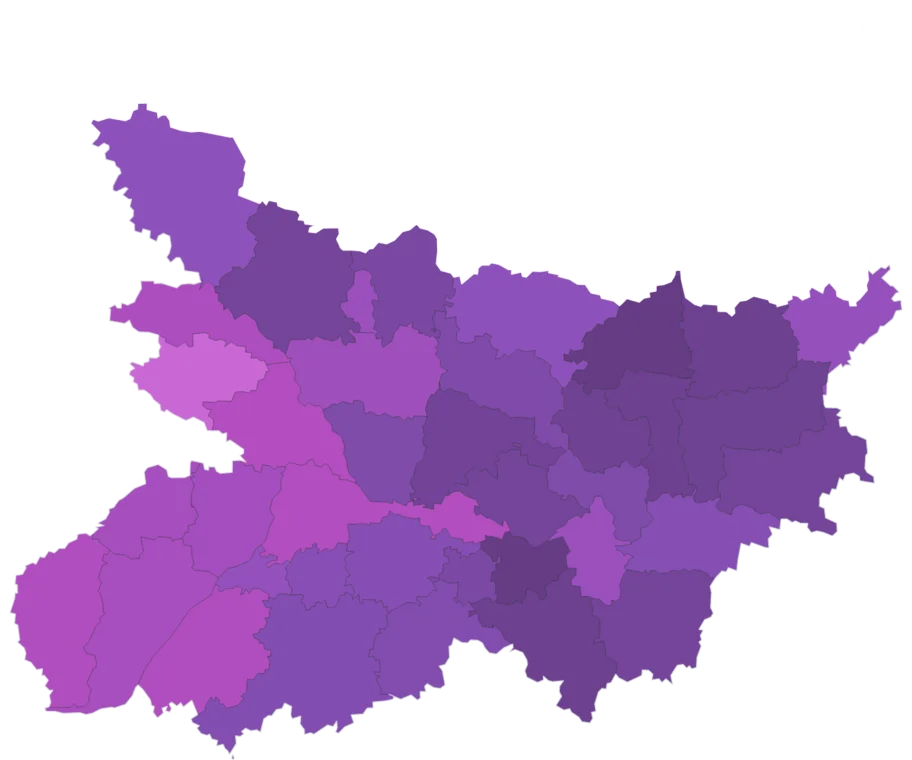
Map itSC and ST students' share of enrolment in classes 11–12, against their share in classes 1–5, 2018-19. 100 means they are as present in classes 11–12 as in primary; below 100 they fall away. From the Ministry of Education's UDISE.
Caveat: 2018-19 school records, before UDISE+ moved to student-level counts. One year compared across classes, not one cohort followed, so students who move district for classes 11–12 count where they study. Not shown where SC and ST students are under 1,000 or 5% of primary enrolment, or over 90%, where the index cannot move far from 100. National: SC+ST 82, SC 89, ST 69. New districts show their parent's value.
Where this data is highest and lowest
Across all 808 districts, by sc/st students reaching class 11–12. Every district has its own page.
Using this data
Free to explore and export. Cite the original publisher for published figures and cite us as well where your result depends on the crosswalk. Per-layer limitations are listed on the caveats page.
The publisher requires this credit wherever their figures appear. Reproduce it as written: