Udyam Registration (MSME)
District-wise registered micro, small, and medium enterprises under Udyam, covering enterprise size and sector.
Published 2026 · 4 indicators · mapped to 808 districts · platform version 2026-09-20
New districts: inherited from parent district
Districts created after this source was published have no measurement of their own. For this source those values are inherited from parent district and flagged in the interface, so you can filter them out. See the methodology for why this method applies here and where it is weakest.
Indicators
Economy
MSME Density
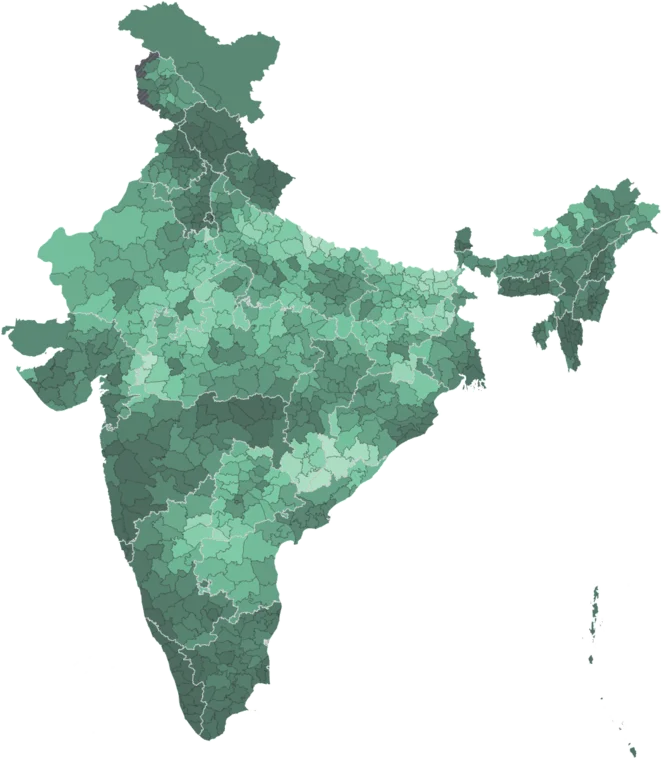
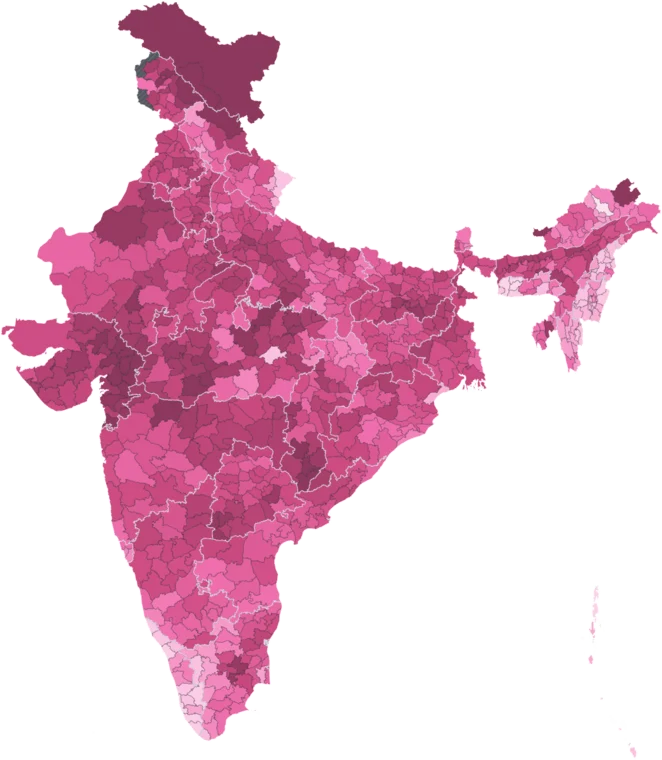
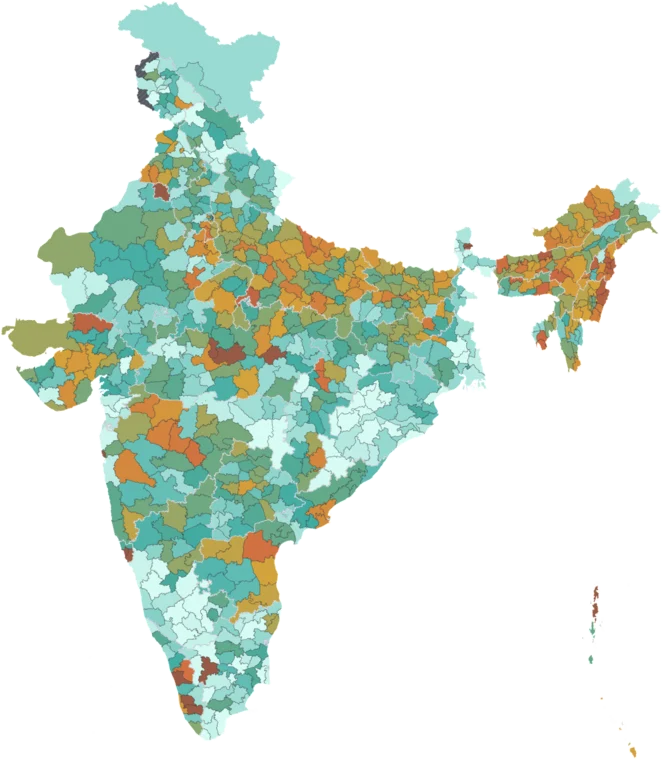
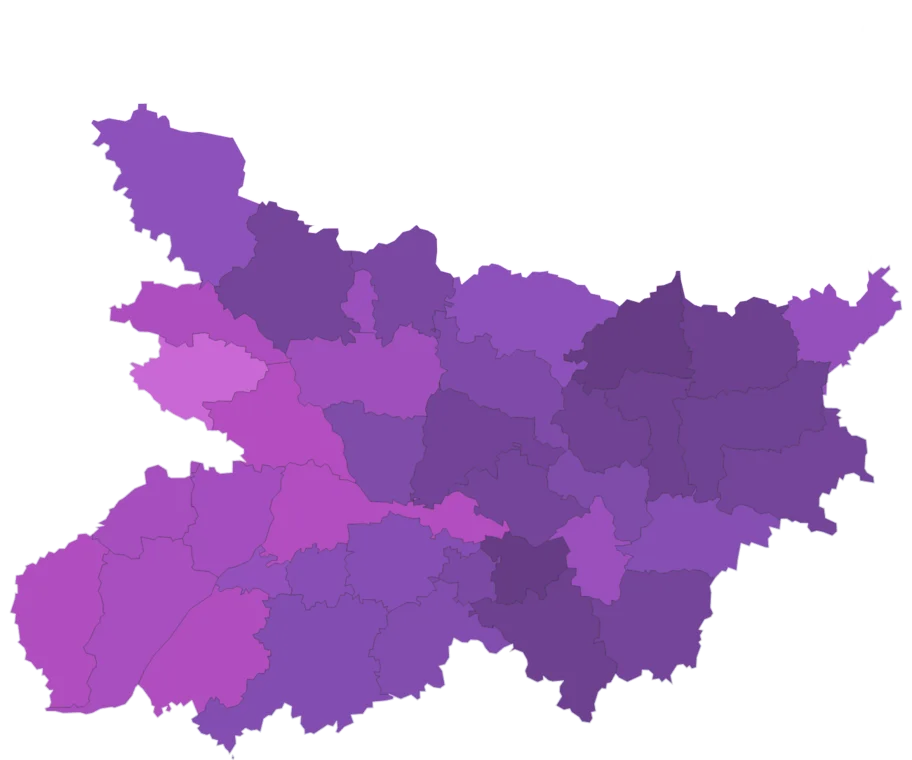
Map itRegistered micro, small, and medium enterprises per 1,000 population. Higher density signals a more entrepreneurial local economy. From Udyam Registration 2026.
Caveat: Registered enterprises only — informal sector excluded. Census 2011 population.
Total MSMEs
Map itTotal number of registered micro, small, and medium enterprises in the district. From Udyam Registration 2026.
Caveat: Registered enterprises only — informal sector excluded.
Manufacturing Share
Map itPercentage of registered MSMEs in the manufacturing sector (vs. services). Higher manufacturing share indicates an industrial economic base. From Udyam Registration 2026.
Caveat: Registered enterprises only. Classified by NIC activity codes.
Small Enterprise Share
Map itPercentage of registered enterprises classified as small (investment ₹1–10 crore). Higher shares indicate more capital-intensive enterprise activity. From Udyam Registration 2026.
Caveat: Registered enterprises only. "Small" = investment ₹1–10 crore.
Where this data is highest and lowest
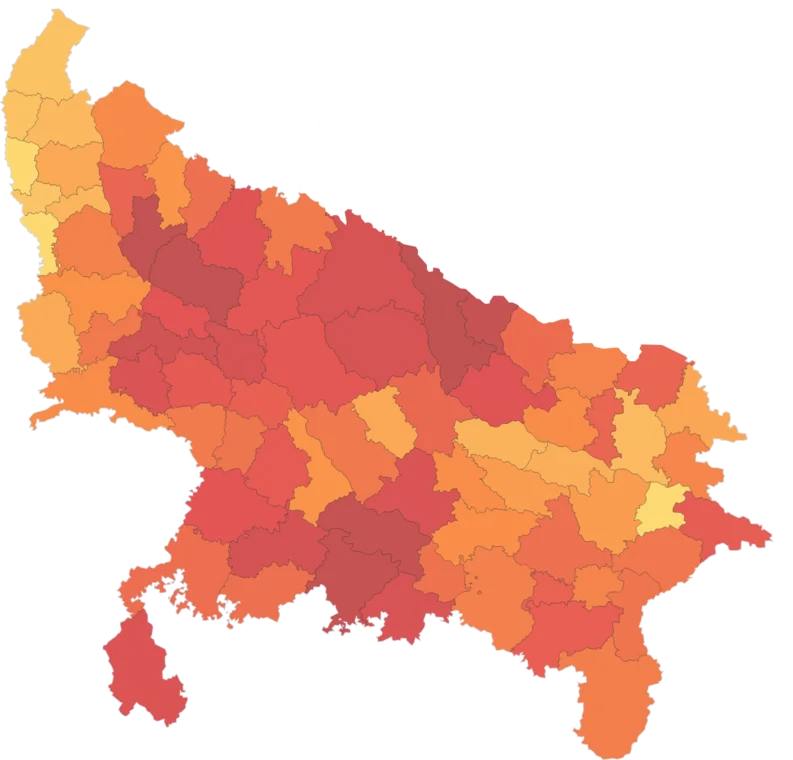
Across all 808 districts, by msme density. Every district has its own page.
Using this data
Free to explore and export. Cite the original publisher for published figures and cite us as well where your result depends on the crosswalk. Per-layer limitations are listed on the caveats page.
The publisher requires this credit wherever their figures appear. Reproduce it as written: