VIIRS Night-time Lights, Annual (EOG)
Annual VIIRS night-time radiance from the Earth Observation Group, 2012–2025, summed over each district with background and fires masked (VNL V2.1 to 2021, V2.2 from 2022).
Published 2012–2025 · 2 indicators · mapped to 808 districts · platform version 2026-10-25
Indicators
Economy
Night-light Brightness
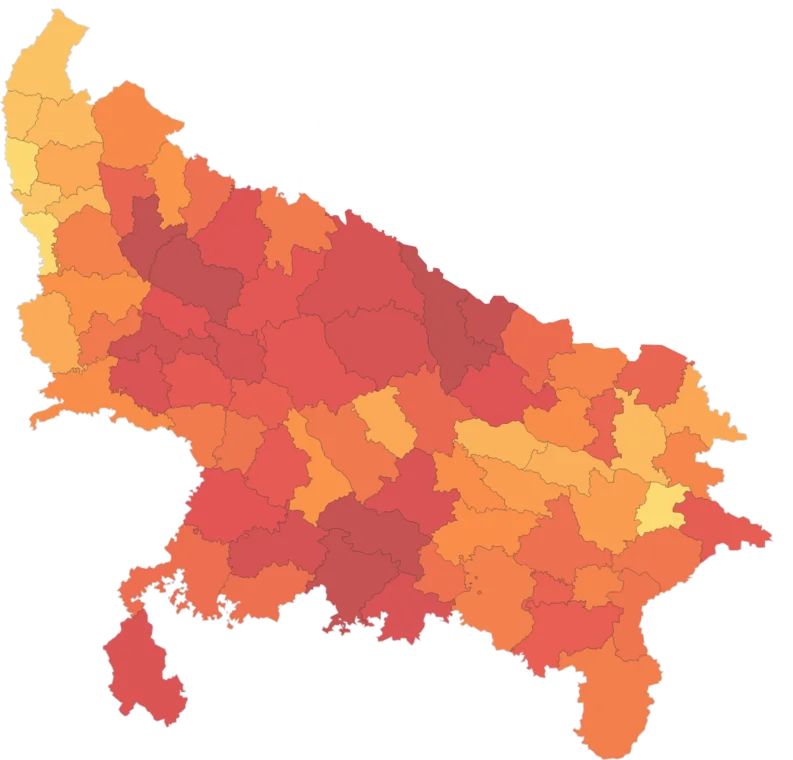
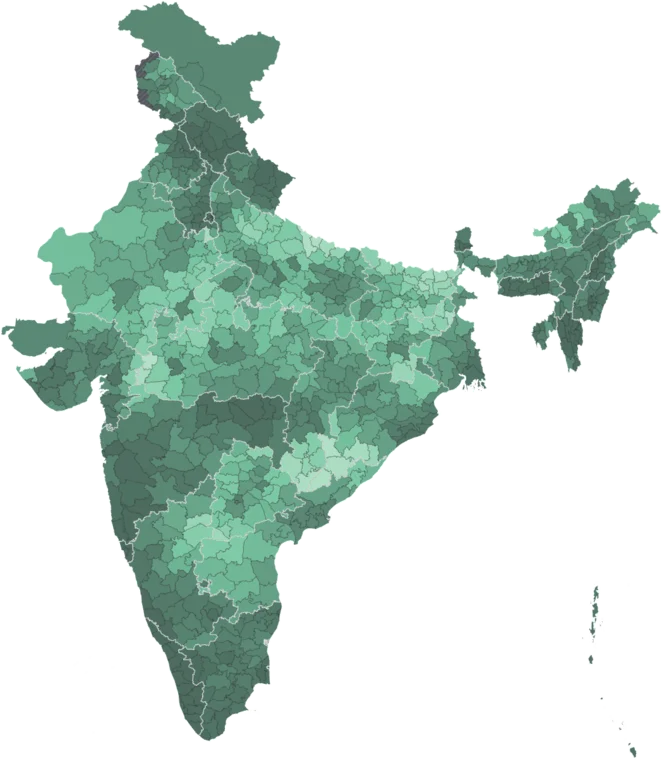
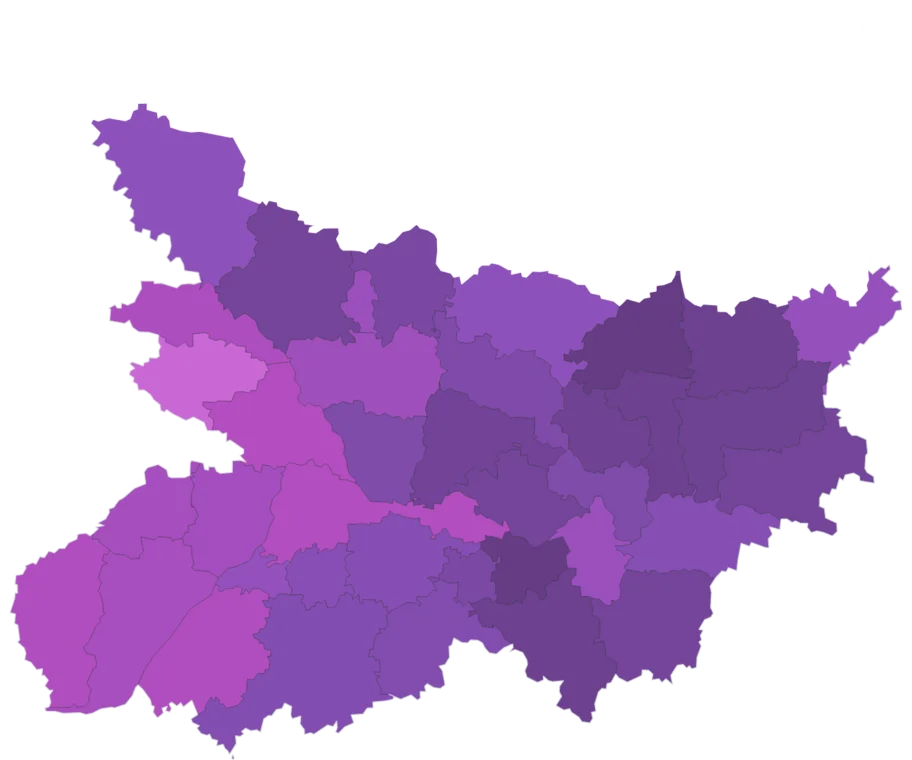
Map itMean night-time radiance over the district in 2025 (nW/cm²/sr), from the EOG VIIRS annual composite with background and fires masked.
Caveat: Light is a proxy for settlement and activity, not income. V2.2 composite; 2022–2025 are not strictly comparable with V2.1 years.
Night-light Growth, 2013–2025
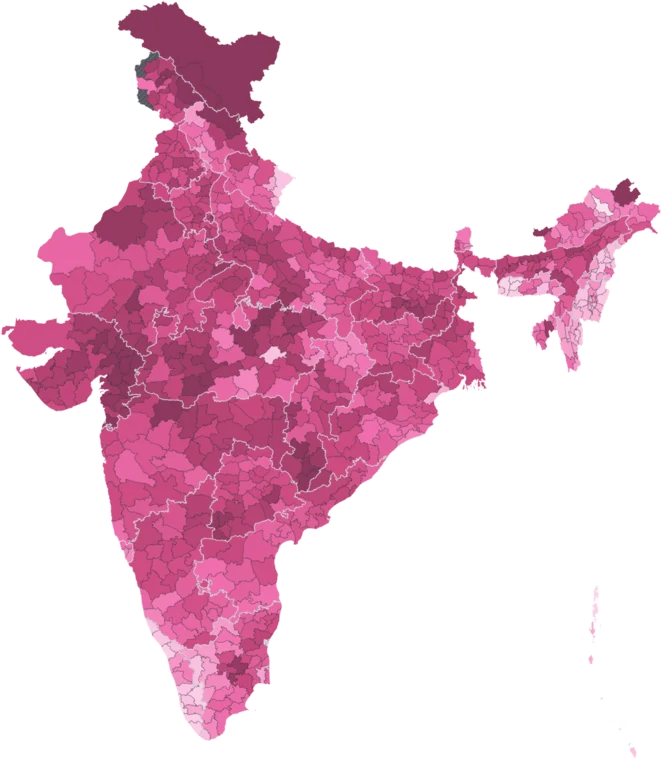
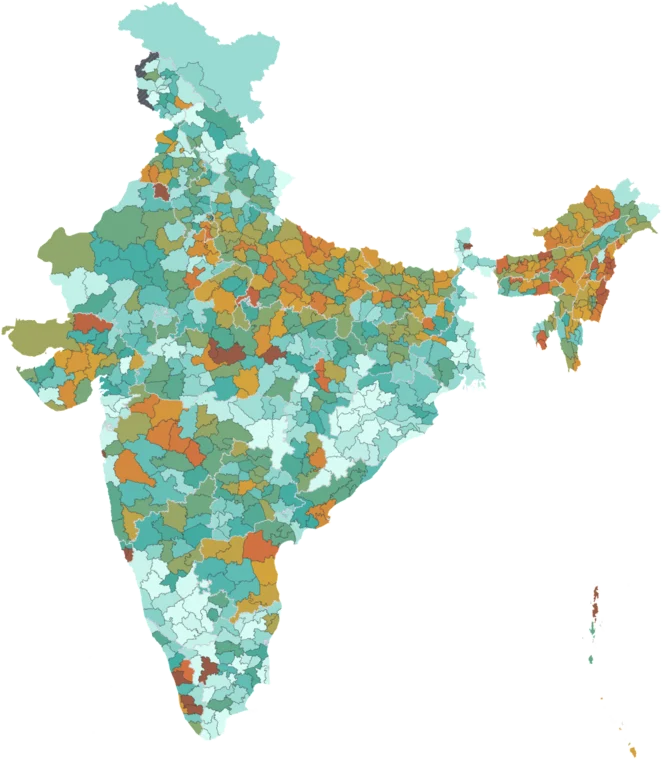
Map itPercent change in the district's sum of night-time lights from 2013 to 2025, from EOG VIIRS annual composites. Blank where the 2013 sum is under 30.
Caveat: Crosses two product changes: stray-light correction from 2014 and V2.1 → V2.2 in 2022. Blank on a tiny 2013 base, where percentages run to extremes.
Using this data
Free to explore and export. Cite the original publisher for published figures and cite us as well where your result depends on the crosswalk. Per-layer limitations are listed on the caveats page.
The publisher requires this credit wherever their figures appear. Reproduce it as written: