Global Forest Change (Hansen, UMD)
Tree cover in 2000 and its loss in each year 2001–2025 from Landsat at 30 m, summed over each district. Tree cover is canopy of 30% or more, which includes plantations.
Published 2000–2025 · 2 indicators · mapped to 808 districts · platform version 2026-10-25
Indicators
Climate & Environment
Tree Cover Lost, 2001–2025
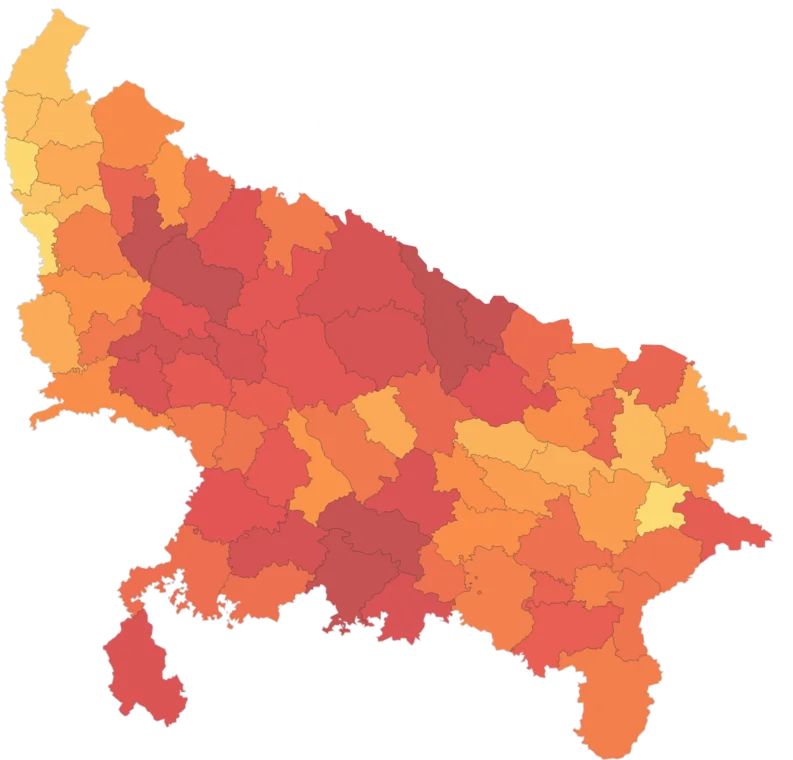
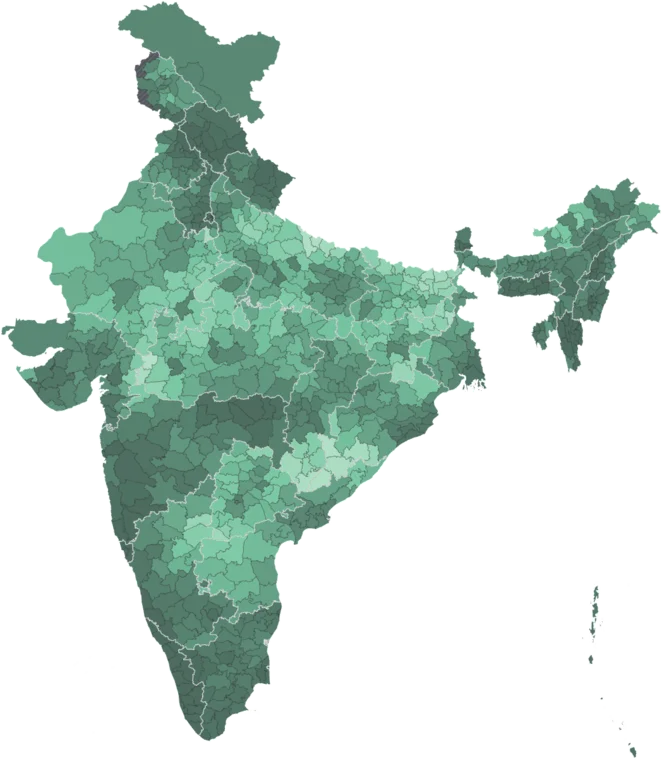
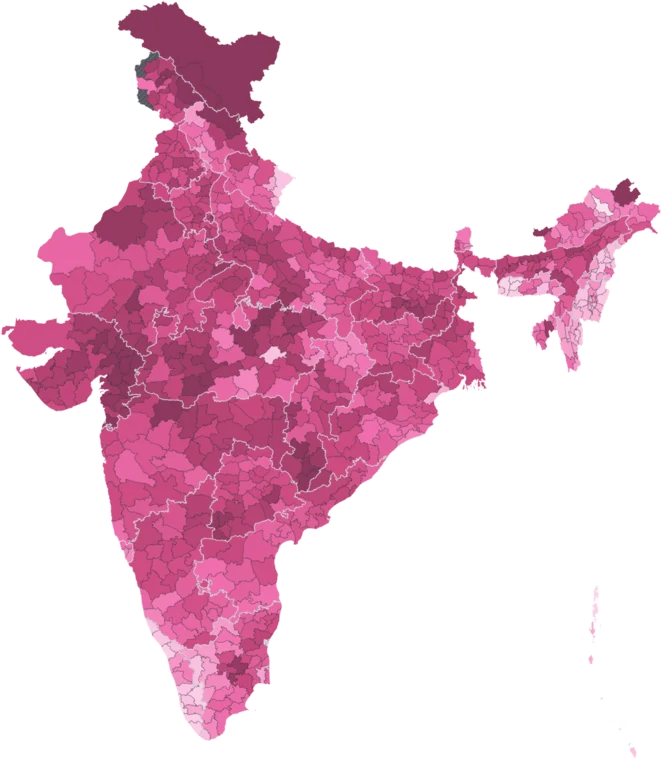
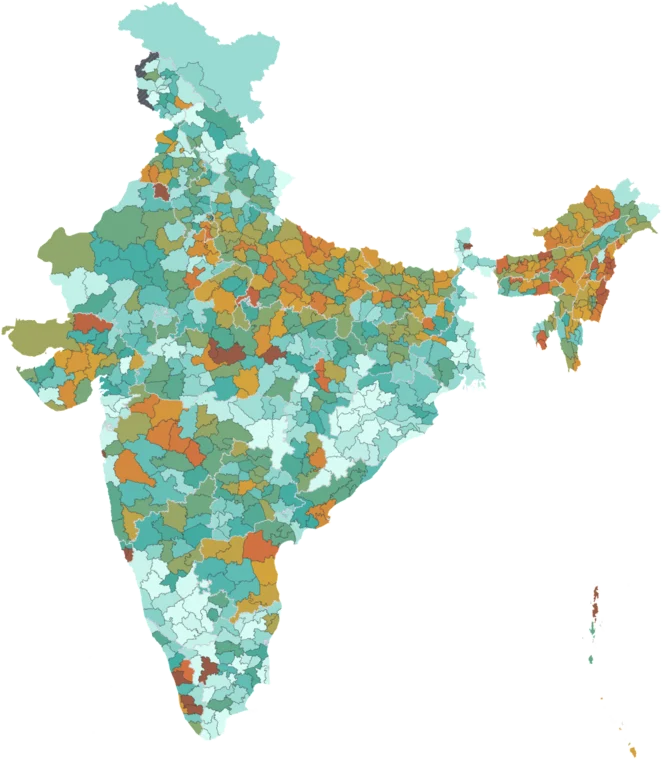
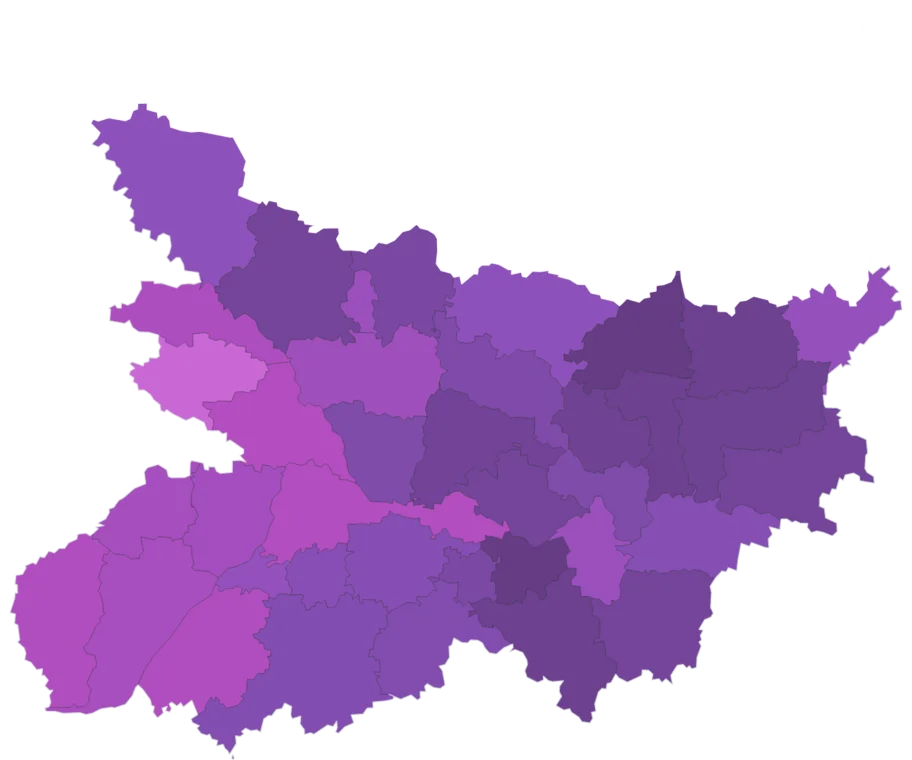
Map itTree cover (canopy ≥ 30% in 2000) lost inside the district between 2001 and 2025, in square kilometres, from Hansen Global Forest Change at 30 m.
Caveat: Includes harvest of plantations and orchards, not only deforestation. Regrowth is not counted.
Share of Tree Cover Lost, 2001–2025
Map itShare of the district's 2000 tree cover (canopy ≥ 30%) lost between 2001 and 2025, from Hansen Global Forest Change. Blank where 2000 tree cover was under 10 km².
Caveat: Includes plantation harvest — high shares in plantation districts are not all deforestation. Regrowth is not counted.
Using this data
Free to explore and export. Cite the original publisher for published figures and cite us as well where your result depends on the crosswalk. Per-layer limitations are listed on the caveats page.
The publisher requires this credit wherever their figures appear. Reproduce it as written: