National Judicial Data Grid
District and taluk court case statistics covering pending cases, disposal rates, and demographic breakdowns.
Published 2024 · 7 indicators · mapped to 808 districts · platform version 2026-09-20
New districts: inherited from parent district
Districts created after this source was published have no measurement of their own. For this source those values are inherited from parent district and flagged in the interface, so you can filter them out. See the methodology for why this method applies here and where it is weakest.
Indicators
Women & Gender
Women's Court Cases
Map itShare of pending cases filed by women
Caveat: District courts only. Based on petitioner gender where recorded.
Governance
Pending Cases per Lakh
Map itPending court cases per 1 lakh population, combining NJDG 2024 case data with Census 2011 population
Caveat: District & subordinate courts only. Population from Census 2011.
Cases Delayed in Disposal
Map itShare of pending cases that have exceeded prescribed disposal timelines
Caveat: District courts only. "Delayed" = exceeded prescribed disposal timelines.
Chronic Backlog (5+ Yr)
Map itShare of pending cases that have been pending for 5 or more years
Caveat: District courts only. Includes both civil and criminal cases.
Monthly Disposal Ratio
Map itCases disposed last month divided by cases filed last month. Above 1.0 means the backlog is shrinking
Caveat: District courts only. Single-month snapshot — seasonal variation possible.
Case Density
Map itPending court cases per square kilometre
Caveat: District courts only. Reflects urbanization as much as caseload.
Women's Court Cases
Map itShare of pending cases filed by women
Caveat: District courts only. Based on petitioner gender where recorded.
Cases at Evidence Stage
Map itShare of pending cases at the evidence, argument, or judgement stage — cases in active hearing
Caveat: District courts only. Combines evidence, argument, and judgement stages.
Where this data is highest and lowest
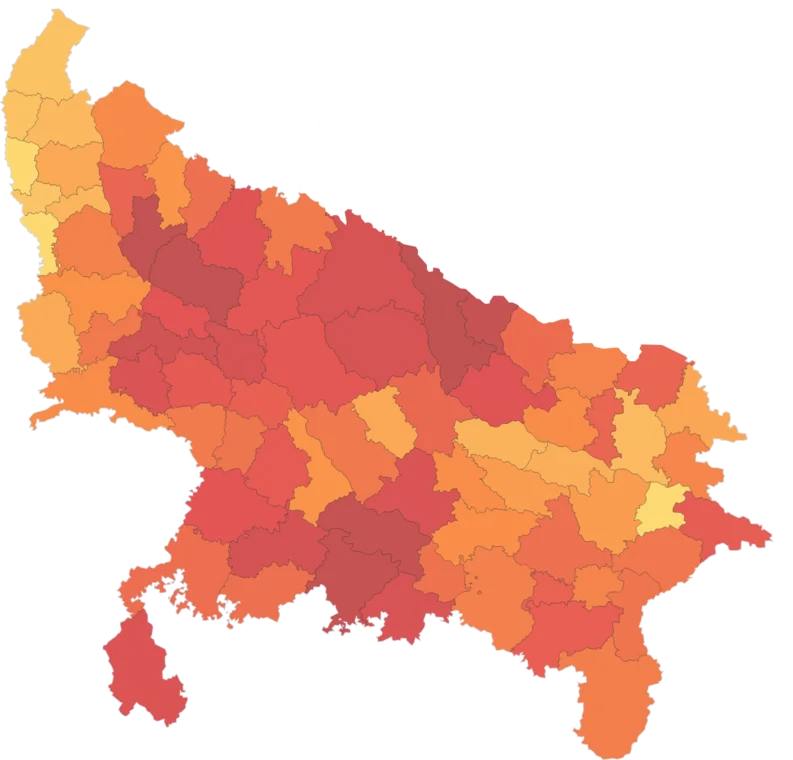
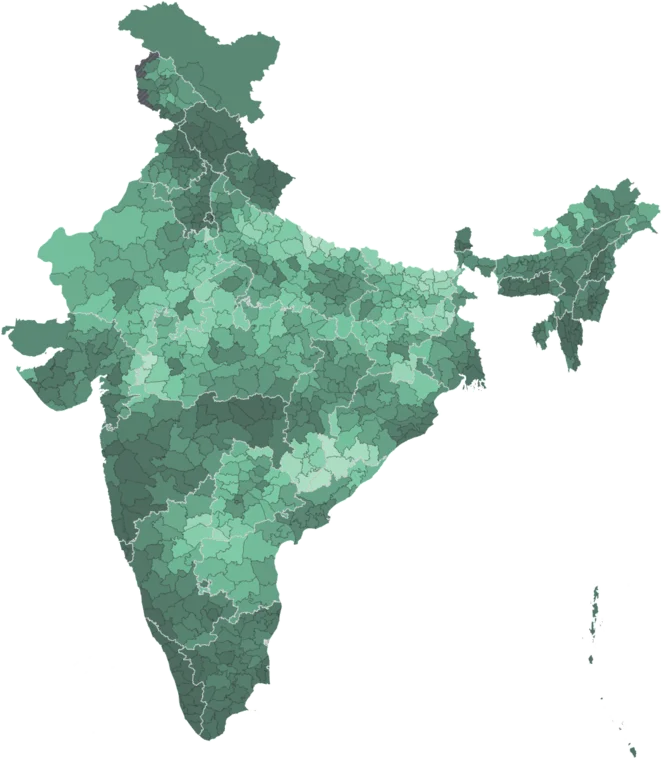
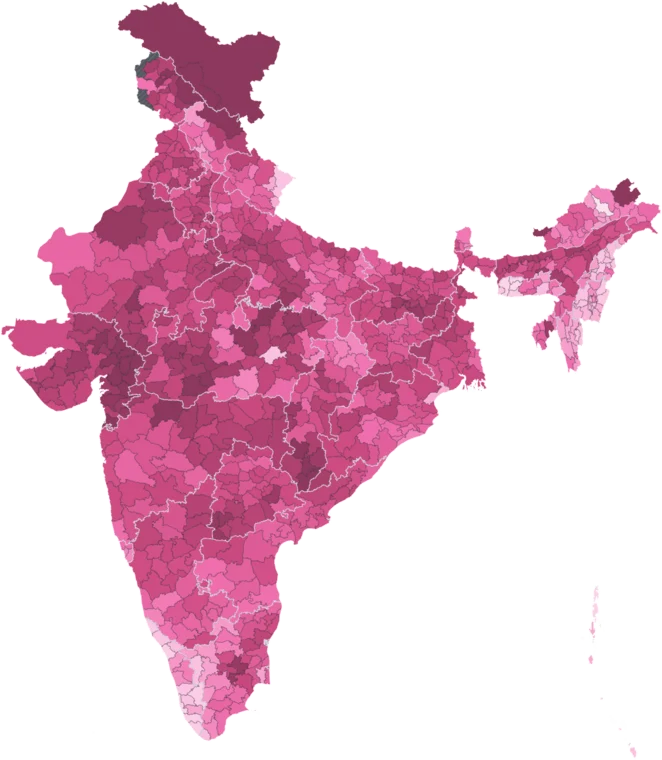
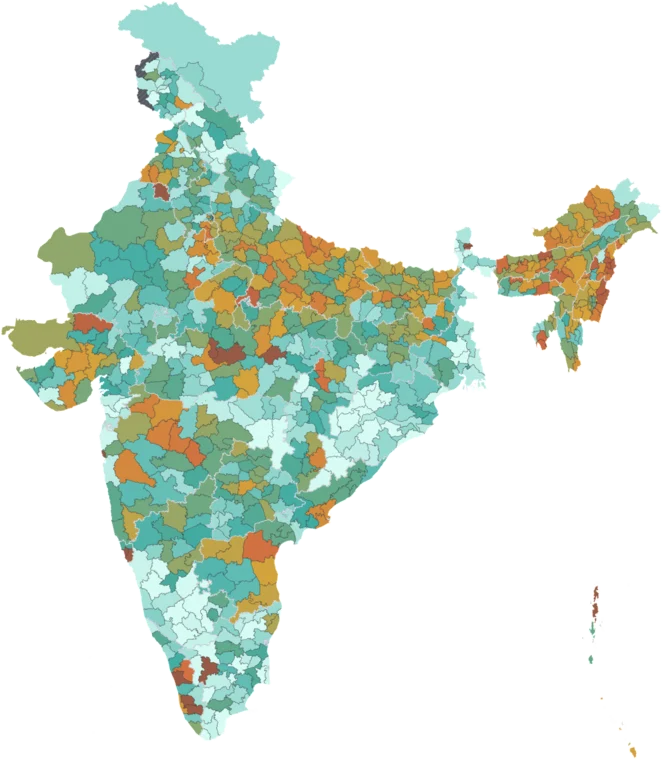
Across all 808 districts, by pending cases per lakh. Every district has its own page.
Using this data
Free to explore and export. Cite the original publisher for published figures and cite us as well where your result depends on the crosswalk. Per-layer limitations are listed on the caveats page.
The publisher requires this credit wherever their figures appear. Reproduce it as written: